Cigna 2009 Annual Report Download - page 147
Download and view the complete annual report
Please find page 147 of the 2009 Cigna annual report below. You can navigate through the pages in the report by either clicking on the pages listed below, or by using the keyword search tool below to find specific information within the annual report.-
 1
1 -
2
-
3
-
4
-
5
-
6
-
7
-
8
-
9
-
10
-
11
-
12
-
13
-
14
-
15
-
16
-
17
-
18
-
19
-
20
-
21
-
22
-
23
-
24
-
25
-
26
-
27
-
28
-
29
-
30
-
31
-
32
-
33
-
34
-
35
-
36
-
37
-
38
-
39
-
40
-
41
-
42
-
43
-
44
-
45
-
46
-
47
-
48
-
49
-
50
-
51
-
52
-
53
-
54
-
55
-
56
-
57
-
58
-
59
-
60
-
61
-
62
-
63
-
64
-
65
-
66
-
67
-
68
-
69
-
70
-
71
-
72
-
73
-
74
-
75
-
76
-
77
-
78
-
79
-
80
-
81
-
82
-
83
-
84
-
85
-
86
-
87
-
88
-
89
-
90
-
91
-
92
-
93
-
94
-
95
-
96
-
97
-
98
-
99
-
100
-
101
-
102
-
103
-
104
-
105
-
106
-
107
-
108
-
109
-
110
-
111
-
112
-
113
-
114
-
115
-
116
-
117
-
118
-
119
-
120
-
121
-
122
-
123
-
124
-
125
-
126
-
127
-
128
-
129
-
130
-
131
-
132
-
133
-
134
-
135
-
136
-
 137
137 -
 138
138 -
 139
139 -
 140
140 -
 141
141 -
 142
142 -
 143
143 -
 144
144 -
 145
145 -
 146
146 -
 147
147 -
 148
148 -
 149
149 -
 150
150 -
 151
151 -
 152
152 -
 153
153 -
 154
154 -
 155
155 -
 156
156 -
 157
157 -
158
-
159
-
160
-
161
-
162
-
163
-
164
-
165
-
166
-
167
-
168
-
169
-
170
-
171
-
172
-
173
-
174
-
175
-
176
-
177
-
178
-
179
-
180
-
181
-
182
-
183
-
184
-
185
-
186
-
187
-
188
-
189
-
190
-
191
-
192
-
193
-
194
-
195
-
196
-
197
-
198
-
199
-
200
-
201
-
202
-
203
-
204
-
205
-
206
-
207
-
208
-
209
-
210
-
211
-
212
-
213
-
214
-
215
-
216
-
217
-
218
-
219
-
220
-
221
-
222
-
223
-
224
-
225
-
226
-
227
-
228
 |
 |

127
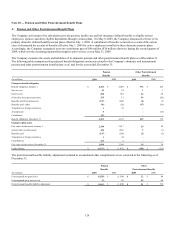
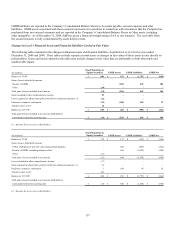
During 2009, the Company’s postretirement benefits liability adjustment increased by $146 million pre-tax ($97 million after-tax)
resulting in a decrease to shareholders’ equity. The increase in the liability was primarily due to:
x decreases in discount rates for both the pension and other postretirement benefit plans;
x actuarial losses primarily relating to census changes and updated medical trend assumptions resulting from the 2009 plan
valuations; and
x the effect of the 2009 curtailment.
Those impacts were partially offset by actual returns on pension plan assets being more favorable than expected in 2009, as both
equity and fixed income markets improved considerably in 2009.
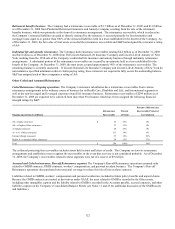
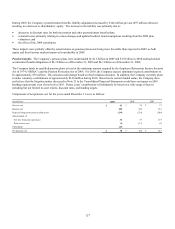
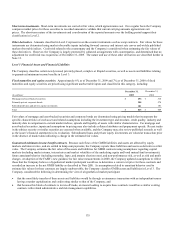
Pension benefits. The Company’s pension plans were underfunded by $1.5 billion in 2009 and $1.9 billion in 2008 and had related
accumulated benefit obligations of $4.3 billion as of December 31, 2009 and $4.1 billion as of December 31, 2008.
The Company funds its qualified pension plans at least at the minimum amount required by the Employee Retirement Income Security
Act of 1974 (“ERISA”) and the Pension Protection Act of 2006. For 2010, the Company expects minimum required contributions to
be approximately $70 million. This amount could change based on final valuation amounts. In addition, the Company currently plans
to make voluntary contributions of approximately $140 million during 2010. Based on its current funded status, the Company does
not believe that the litigation matter discussed in Note 23 to the Consolidated Financial Statements would have an impact on 2010
funding requirements even if resolved in 2010. Future years’ contributions will ultimately be based on a wide range of factors
including but not limited to asset returns, discount rates, and funding targets.
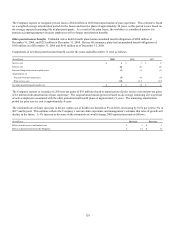
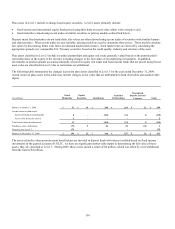
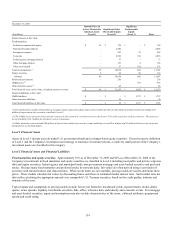
Components of net pension cost for the years ended December 31 were as follows:
(In millions) 2009 2008 2007
Service cost $ 43 $ 74 $ 73
Interest cost 250 242 231
Expected long-term return on plan assets (239) (234) (209)
Amortization of:
Net loss from past experience 34 57 119
Prior service cost (4) (11) (1)
Curtailment (46) - -
Net pension cost $ 38 $ 128 $ 213