Cigna 2009 Annual Report Download - page 166
Download and view the complete annual report
Please find page 166 of the 2009 Cigna annual report below. You can navigate through the pages in the report by either clicking on the pages listed below, or by using the keyword search tool below to find specific information within the annual report.-
 1
1 -
2
-
3
-
4
-
5
-
6
-
7
-
8
-
9
-
10
-
11
-
12
-
13
-
14
-
15
-
16
-
17
-
18
-
19
-
20
-
21
-
22
-
23
-
24
-
25
-
26
-
27
-
28
-
29
-
30
-
31
-
32
-
33
-
34
-
35
-
36
-
37
-
38
-
39
-
40
-
41
-
42
-
43
-
44
-
45
-
46
-
47
-
48
-
49
-
50
-
51
-
52
-
53
-
54
-
55
-
56
-
57
-
58
-
59
-
60
-
61
-
62
-
63
-
64
-
65
-
66
-
67
-
68
-
69
-
70
-
71
-
72
-
73
-
74
-
75
-
76
-
77
-
78
-
79
-
80
-
81
-
82
-
83
-
84
-
85
-
86
-
87
-
88
-
89
-
90
-
91
-
92
-
93
-
94
-
95
-
96
-
97
-
98
-
99
-
100
-
101
-
102
-
103
-
104
-
105
-
106
-
107
-
108
-
109
-
110
-
111
-
112
-
113
-
114
-
115
-
116
-
117
-
118
-
119
-
120
-
121
-
122
-
123
-
124
-
125
-
126
-
127
-
128
-
129
-
130
-
131
-
132
-
133
-
134
-
135
-
136
-
137
-
138
-
139
-
140
-
141
-
142
-
143
-
144
-
145
-
146
-
147
-
148
-
149
-
150
-
151
-
152
-
153
-
154
-
155
-
 156
156 -
 157
157 -
 158
158 -
 159
159 -
 160
160 -
 161
161 -
 162
162 -
 163
163 -
 164
164 -
 165
165 -
 166
166 -
 167
167 -
 168
168 -
 169
169 -
 170
170 -
 171
171 -
 172
172 -
 173
173 -
 174
174 -
 175
175 -
 176
176 -
177
-
178
-
179
-
180
-
181
-
182
-
183
-
184
-
185
-
186
-
187
-
188
-
189
-
190
-
191
-
192
-
193
-
194
-
195
-
196
-
197
-
198
-
199
-
200
-
201
-
202
-
203
-
204
-
205
-
206
-
207
-
208
-
209
-
210
-
211
-
212
-
213
-
214
-
215
-
216
-
217
-
218
-
219
-
220
-
221
-
222
-
223
-
224
-
225
-
226
-
227
-
228
 |
 |
146
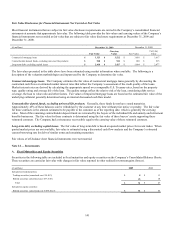
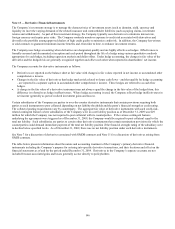
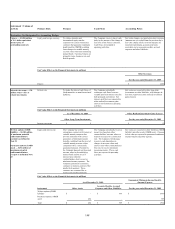
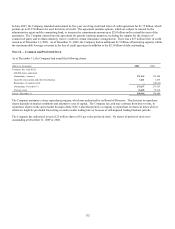
Note 13 — Derivative Financial Instruments
The Company’s investment strategy is to manage the characteristics of investment assets (such as duration, yield, currency and
liquidity) to meet the varying demands of the related insurance and contractholder liabilities (such as paying claims, investment
returns and withdrawals). As part of this investment strategy, the Company typically uses derivatives to minimize interest rate,
foreign currency and equity price risks. The Company routinely monitors exposure to credit risk associated with derivatives and
diversifies the portfolio among approved dealers of high credit quality to minimize credit risk. In addition, the Company has written
or sold contracts to guarantee minimum income benefits and, from time to time, to enhance investment returns.
The Company uses hedge accounting when derivatives are designated, qualify and are highly effective as hedges. Effectiveness is
formally assessed and documented at inception and each period throughout the life of a hedge using various quantitative methods
appropriate for each hedge, including regression analysis and dollar offset. Under hedge accounting, the changes in fair value of the
derivative and the hedged risk are generally recognized together and offset each other when reported in shareholders’ net income.
The Company accounts for derivative instruments as follows:
x Derivatives are reported on the balance sheet at fair value with changes in fair values reported in net income or accumulated other
comprehensive income.
x Changes in the fair value of derivatives that hedge market risk related to future cash flows – and that qualify for hedge accounting
– are reported in a separate caption in accumulated other comprehensive income. These hedges are referred to as cash flow
hedges.
x A change in the fair value of a derivative instrument may not always equal the change in the fair value of the hedged item; this
difference is referred to as hedge ineffectiveness. Where hedge accounting is used, the Company reflects hedge ineffectiveness in
net income (generally as part of realized investment gains and losses).
Certain subsidiaries of the Company are parties to over-the-counter derivative instruments that contain provisions requiring both
parties to such instruments to post collateral depending on net liability thresholds and the party’s financial strength or credit rating.
The collateral posting requirements vary by counterparty. The aggregate fair value of derivative instruments with such credit-risk-
related contingent features where subsidiaries of the Company were in a net liability position as of December 31, 2009 was $29
million for which the Company was not required to post collateral with its counterparties. If the various contingent features
underlying the agreements were triggered as of December 31, 2009, the Company would be required to post collateral equal to the
total net liability. Such subsidiaries are parties to certain other derivative instruments that contain termination provisions for which the
counterparties could demand immediate payment of the total net liability position if the financial strength rating of the subsidiary were
to decline below specified levels. As of December 31, 2009, there was no net liability position under such derivative instruments.
See Note 7 for a discussion of derivatives associated with GMDB contracts and Note 11 for a discussion of derivatives arising from
GMIB contracts.
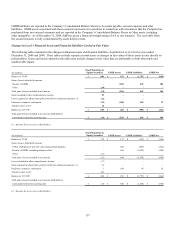
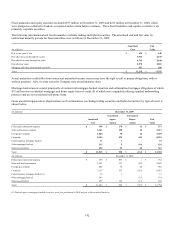
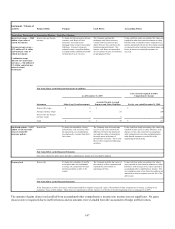
The table below presents information about the nature and accounting treatment of the Company’s primary derivative financial
instruments including the Company’s purpose for entering into specific derivative transactions, and their locations and effect on the
financial statements as of and for the period ended December 31, 2009. Derivatives in the Company’s separate accounts are not
included because associated gains and losses generally accrue directly to policyholders.