Cigna 2009 Annual Report Download - page 152
Download and view the complete annual report
Please find page 152 of the 2009 Cigna annual report below. You can navigate through the pages in the report by either clicking on the pages listed below, or by using the keyword search tool below to find specific information within the annual report.-
 1
1 -
2
-
3
-
4
-
5
-
6
-
7
-
8
-
9
-
10
-
11
-
12
-
13
-
14
-
15
-
16
-
17
-
18
-
19
-
20
-
21
-
22
-
23
-
24
-
25
-
26
-
27
-
28
-
29
-
30
-
31
-
32
-
33
-
34
-
35
-
36
-
37
-
38
-
39
-
40
-
41
-
42
-
43
-
44
-
45
-
46
-
47
-
48
-
49
-
50
-
51
-
52
-
53
-
54
-
55
-
56
-
57
-
58
-
59
-
60
-
61
-
62
-
63
-
64
-
65
-
66
-
67
-
68
-
69
-
70
-
71
-
72
-
73
-
74
-
75
-
76
-
77
-
78
-
79
-
80
-
81
-
82
-
83
-
84
-
85
-
86
-
87
-
88
-
89
-
90
-
91
-
92
-
93
-
94
-
95
-
96
-
97
-
98
-
99
-
100
-
101
-
102
-
103
-
104
-
105
-
106
-
107
-
108
-
109
-
110
-
111
-
112
-
113
-
114
-
115
-
116
-
117
-
118
-
119
-
120
-
121
-
122
-
123
-
124
-
125
-
126
-
127
-
128
-
129
-
130
-
131
-
132
-
133
-
134
-
135
-
136
-
137
-
138
-
139
-
140
-
141
-
 142
142 -
 143
143 -
 144
144 -
 145
145 -
 146
146 -
 147
147 -
 148
148 -
 149
149 -
 150
150 -
 151
151 -
 152
152 -
 153
153 -
 154
154 -
 155
155 -
 156
156 -
 157
157 -
 158
158 -
 159
159 -
 160
160 -
 161
161 -
 162
162 -
163
-
164
-
165
-
166
-
167
-
168
-
169
-
170
-
171
-
172
-
173
-
174
-
175
-
176
-
177
-
178
-
179
-
180
-
181
-
182
-
183
-
184
-
185
-
186
-
187
-
188
-
189
-
190
-
191
-
192
-
193
-
194
-
195
-
196
-
197
-
198
-
199
-
200
-
201
-
202
-
203
-
204
-
205
-
206
-
207
-
208
-
209
-
210
-
211
-
212
-
213
-
214
-
215
-
216
-
217
-
218
-
219
-
220
-
221
-
222
-
223
-
224
-
225
-
226
-
227
-
228
 |
 |

132
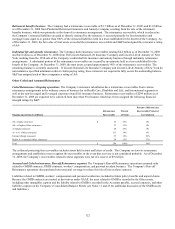
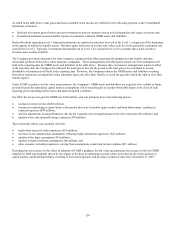
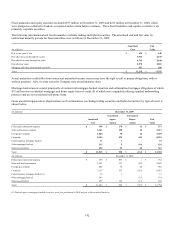
B. 401(k) Plans
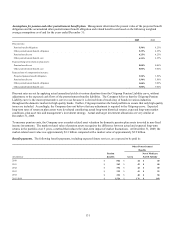
The Company sponsors a 401(k) plan in which the Company matches a portion of employees’ pre-tax contributions. Another 401(k)
plan with an employer match was frozen in 1999. Participants in the active plan may invest in a fund that invests in the Company’s
common stock, several diversified stock funds, a bond fund and a fixed-income fund.
The Company may elect to increase its matching contributions if the Company’s annual performance meets certain targets. A
substantial amount of the Company’s matching contributions are invested in the Company common stock. The Company’s expense
for these plans was $36 million for 2009, $34 million for 2008 and $35 million for 2007.
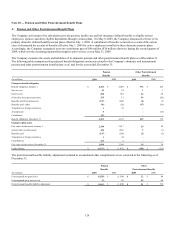
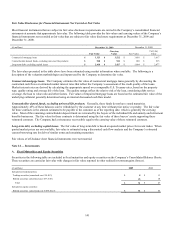
Note 11 Fair Value Measurements
The Company carries certain financial instruments at fair value in the financial statements including fixed maturities, equity securities,
short-term investments and derivatives. Other financial instruments are measured at fair value under certain conditions, such as when
impaired or, for commercial mortgage loans, when classified as “held for sale.”
Fair value is defined as the price at which an asset could be exchanged in an orderly transaction between market participants at the
balance sheet date. A liability’s fair value is defined as the amount that would be paid to transfer the liability to a market participant,
not the amount that would be paid to settle the liability with the creditor.
Fair values are based on quoted market prices when available. When market prices are not available, fair value is generally estimated
using discounted cash flow analyses, incorporating current market inputs for similar financial instruments with comparable terms and
credit quality. In instances where there is little or no market activity for the same or similar instruments, the Company estimates fair
value using methods, models and assumptions that the Company believes a hypothetical market participant would use to determine a
current transaction price. These valuation techniques involve some level of estimation and judgment by the Company which becomes
significant with increasingly complex instruments or pricing models. Where appropriate, adjustments are included to reflect the risk
inherent in a particular methodology, model or input used.
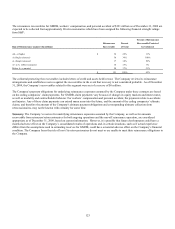
The Company’s financial assets and liabilities carried at fair value have been classified based upon a hierarchy defined by
GAAP. The hierarchy gives the highest ranking to fair values determined using unadjusted quoted prices in active markets for
identical assets and liabilities (Level 1) and the lowest ranking to fair values determined using methodologies and models with
unobservable inputs (Level 3). An asset’s or a liability’s classification is based on the lowest level input that is significant to its
measurement. For example, a Level 3 fair value measurement may include inputs that are both observable (Levels 1 and 2) and
unobservable (Level 3). The levels of the fair value hierarchy are as follows:
x Level 1 – Values are unadjusted quoted prices for identical assets and liabilities in active markets accessible at the measurement
date. Active markets provide pricing data for trades occurring at least weekly and include exchanges and dealer markets.
x Level 2 – Inputs include quoted prices for similar assets or liabilities in active markets, quoted prices from those willing to trade
in markets that are not active, or other inputs that are observable or can be corroborated by market data for the term of the
instrument. Such inputs include market interest rates and volatilities, spreads and yield curves. An instrument is classified in
Level 2 if the Company determines that unobservable inputs are insignificant.
x Level 3 – Certain inputs are unobservable (supported by little or no market activity) and significant to the fair value
measurement. Unobservable inputs reflect the Company’s best estimate of what hypothetical market participants would use to
determine a transaction price for the asset or liability at the reporting date.