Cigna 2009 Annual Report Download - page 151
Download and view the complete annual report
Please find page 151 of the 2009 Cigna annual report below. You can navigate through the pages in the report by either clicking on the pages listed below, or by using the keyword search tool below to find specific information within the annual report.-
 1
1 -
2
-
3
-
4
-
5
-
6
-
7
-
8
-
9
-
10
-
11
-
12
-
13
-
14
-
15
-
16
-
17
-
18
-
19
-
20
-
21
-
22
-
23
-
24
-
25
-
26
-
27
-
28
-
29
-
30
-
31
-
32
-
33
-
34
-
35
-
36
-
37
-
38
-
39
-
40
-
41
-
42
-
43
-
44
-
45
-
46
-
47
-
48
-
49
-
50
-
51
-
52
-
53
-
54
-
55
-
56
-
57
-
58
-
59
-
60
-
61
-
62
-
63
-
64
-
65
-
66
-
67
-
68
-
69
-
70
-
71
-
72
-
73
-
74
-
75
-
76
-
77
-
78
-
79
-
80
-
81
-
82
-
83
-
84
-
85
-
86
-
87
-
88
-
89
-
90
-
91
-
92
-
93
-
94
-
95
-
96
-
97
-
98
-
99
-
100
-
101
-
102
-
103
-
104
-
105
-
106
-
107
-
108
-
109
-
110
-
111
-
112
-
113
-
114
-
115
-
116
-
117
-
118
-
119
-
120
-
121
-
122
-
123
-
124
-
125
-
126
-
127
-
128
-
129
-
130
-
131
-
132
-
133
-
134
-
135
-
136
-
137
-
138
-
139
-
140
-
 141
141 -
 142
142 -
 143
143 -
 144
144 -
 145
145 -
 146
146 -
 147
147 -
 148
148 -
 149
149 -
 150
150 -
 151
151 -
 152
152 -
 153
153 -
 154
154 -
 155
155 -
 156
156 -
 157
157 -
 158
158 -
 159
159 -
 160
160 -
 161
161 -
162
-
163
-
164
-
165
-
166
-
167
-
168
-
169
-
170
-
171
-
172
-
173
-
174
-
175
-
176
-
177
-
178
-
179
-
180
-
181
-
182
-
183
-
184
-
185
-
186
-
187
-
188
-
189
-
190
-
191
-
192
-
193
-
194
-
195
-
196
-
197
-
198
-
199
-
200
-
201
-
202
-
203
-
204
-
205
-
206
-
207
-
208
-
209
-
210
-
211
-
212
-
213
-
214
-
215
-
216
-
217
-
218
-
219
-
220
-
221
-
222
-
223
-
224
-
225
-
226
-
227
-
228
 |
 |

131
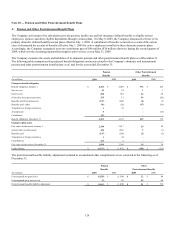
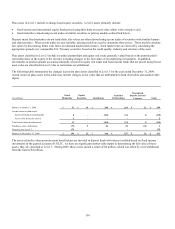
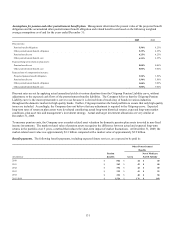
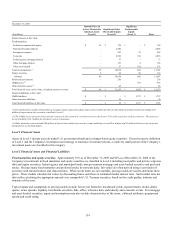
Assumptions for pension and other postretirement benefit plans. Management determined the present value of the projected benefit
obligation and the accumulated other postretirement benefit obligation and related benefit costs based on the following weighted
average assumptions as of and for the years ended December 31:
2009 2008
Discount rate:
Pension benefit obligation 5.50% 6.25%
Other postretirement benefit obligation 5.25% 6.25%
Pension benefit cost 6.25% 6.25%
Other postretirement benefit cost 6.25% 6.25%
Expected long-term return on plan assets:
Pension benefit cost 8.00% 8.00%
Other postretirement benefit cost 5.00% 5.00%
Expected rate of compensation increase:
Projected pension benefit obligation 3.50% 3.50%
Pension benefit cost 3.50% 3.50%
Other postretirement benefit obligation 3.00% 3.00%
Other postretirement benefit cost 3.00% 3.00%
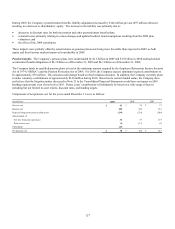
Discount rates are set by applying actual annualized yields at various durations from the Citigroup Pension Liability curve, without
adjustment, to the expected cash flows of the postretirement benefits liabilities. The Company believes that the Citigroup Pension
Liability curve is the most representative curve to use because it is derived from a broad array of bonds in various industries
throughout the domestic market for high quality bonds. Further, Citigroup monitors the bond portfolio to ensure that only high quality
issues are included. Accordingly, the Company does not believe that any adjustment is required to the Citigroup curve. Expected
long-term rates of return on plan assets were developed considering actual long-term historical returns, expected long-term market
conditions, plan asset mix and management’s investment strategy. Actual and target investment allocations are very similar at
December 31, 2009.
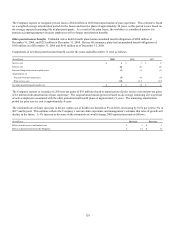
To measure pension costs, the Company uses a market-related asset valuation for domestic pension plan assets invested in non-fixed
income investments. The market-related value of pension assets recognizes the difference between actual and expected long-term
returns in the portfolio over 5 years, a method that reduces the short-term impact of market fluctuations. At December 31, 2009, the
market-related asset value was approximately $3.3 billion compared with a market value of approximately $2.9 billion.
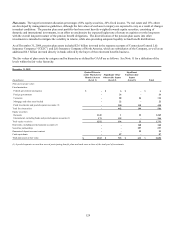
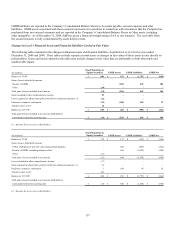
Benefit payments. The following benefit payments, including expected future services, are expected to be paid in:
Other Postretirement
Benefits
Pension Net of Medicare
(In millions) Benefits Gross Part D Subsidy
2010 $ 502 $ 44 $ 40
2011 $ 343 $ 42 $ 40
2012 $ 332 $ 42 $ 40
2013 $ 319 $ 41 $ 39
2014 $ 321 $ 40 $ 38
2015-2019 $ 1,526 $ 176 $ 169