Cigna 2009 Annual Report Download - page 85
Download and view the complete annual report
Please find page 85 of the 2009 Cigna annual report below. You can navigate through the pages in the report by either clicking on the pages listed below, or by using the keyword search tool below to find specific information within the annual report.-
 1
1 -
2
-
3
-
4
-
5
-
6
-
7
-
8
-
9
-
10
-
11
-
12
-
13
-
14
-
15
-
16
-
17
-
18
-
19
-
20
-
21
-
22
-
23
-
24
-
25
-
26
-
27
-
28
-
29
-
30
-
31
-
32
-
33
-
34
-
35
-
36
-
37
-
38
-
39
-
40
-
41
-
42
-
43
-
44
-
45
-
46
-
47
-
48
-
49
-
50
-
51
-
52
-
53
-
54
-
55
-
56
-
57
-
58
-
59
-
60
-
61
-
62
-
63
-
64
-
65
-
66
-
67
-
68
-
69
-
70
-
71
-
72
-
73
-
74
-
 75
75 -
 76
76 -
 77
77 -
 78
78 -
 79
79 -
 80
80 -
 81
81 -
 82
82 -
 83
83 -
 84
84 -
 85
85 -
 86
86 -
 87
87 -
 88
88 -
 89
89 -
 90
90 -
 91
91 -
 92
92 -
 93
93 -
 94
94 -
 95
95 -
96
-
97
-
98
-
99
-
100
-
101
-
102
-
103
-
104
-
105
-
106
-
107
-
108
-
109
-
110
-
111
-
112
-
113
-
114
-
115
-
116
-
117
-
118
-
119
-
120
-
121
-
122
-
123
-
124
-
125
-
126
-
127
-
128
-
129
-
130
-
131
-
132
-
133
-
134
-
135
-
136
-
137
-
138
-
139
-
140
-
141
-
142
-
143
-
144
-
145
-
146
-
147
-
148
-
149
-
150
-
151
-
152
-
153
-
154
-
155
-
156
-
157
-
158
-
159
-
160
-
161
-
162
-
163
-
164
-
165
-
166
-
167
-
168
-
169
-
170
-
171
-
172
-
173
-
174
-
175
-
176
-
177
-
178
-
179
-
180
-
181
-
182
-
183
-
184
-
185
-
186
-
187
-
188
-
189
-
190
-
191
-
192
-
193
-
194
-
195
-
196
-
197
-
198
-
199
-
200
-
201
-
202
-
203
-
204
-
205
-
206
-
207
-
208
-
209
-
210
-
211
-
212
-
213
-
214
-
215
-
216
-
217
-
218
-
219
-
220
-
221
-
222
-
223
-
224
-
225
-
226
-
227
-
228
 |
 |

65
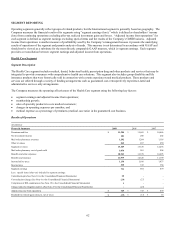
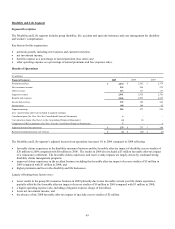
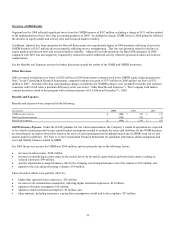
Benefits and Expenses
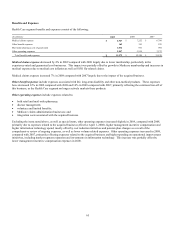
Health Care segment benefits and expenses consist of the following:
(In millions) 2009 2008 2007
Medical claims expense $ 6,927 $ 7,252 $ 6,798
Other benefit expenses 169 193 225
Mail order pharmacy cost of goods sold 1,036 961 904
Other operating expenses 3,847 3,914 3,272
Total benefits and expenses $ 11,979 $ 12,320 $ 11,199
Medical claims expense decreased by 4% in 2009 compared with 2008 largely due to lower membership, particularly in the
experience-rated and guaranteed cost businesses. This impact was partially offset by growth in Medicare membership and increases in
medical expenses due to medical cost inflation as well as H1N1 flu-related claims.
Medical claims expense increased 7% in 2008 compared with 2007 largely due to the impact of the acquired business.
Other benefit expenses include expenses associated with life, long-term disability and other non-medical products. These expenses
have decreased 12% in 2009 compared with 2008 and 14% in 2008 compared with 2007, primarily reflecting the continued run-off of
this business, as the Health Care segment no longer actively markets these products.
Other operating expenses include expenses related to:
x both retail and mail order pharmacy;
x disease management;
x voluntary and limited benefits;
x Medicare claims administration businesses; and
x integration costs associated with the acquired business.
Excluding the items noted above, as well as special items, other operating expenses increased slightly in 2009, compared with 2008,
primarily due to expenses related to the acquired business (effective April 1, 2008), higher management incentive compensation and
higher information technology spend, mostly offset by cost reduction initiatives and pension plan changes as a result of the
comprehensive review of ongoing expenses, as well as lower volume-related expenses. Other operating expenses increased in 2008,
compared with 2007, primarily reflecting expenses related to the acquired business and higher spending on operational improvement
initiatives, including market segment expansion and investments in information technology. This increase was partially offset by
lower management incentive compensation expenses in 2008.