Cigna 2009 Annual Report Download - page 92
Download and view the complete annual report
Please find page 92 of the 2009 Cigna annual report below. You can navigate through the pages in the report by either clicking on the pages listed below, or by using the keyword search tool below to find specific information within the annual report.-
 1
1 -
2
-
3
-
4
-
5
-
6
-
7
-
8
-
9
-
10
-
11
-
12
-
13
-
14
-
15
-
16
-
17
-
18
-
19
-
20
-
21
-
22
-
23
-
24
-
25
-
26
-
27
-
28
-
29
-
30
-
31
-
32
-
33
-
34
-
35
-
36
-
37
-
38
-
39
-
40
-
41
-
42
-
43
-
44
-
45
-
46
-
47
-
48
-
49
-
50
-
51
-
52
-
53
-
54
-
55
-
56
-
57
-
58
-
59
-
60
-
61
-
62
-
63
-
64
-
65
-
66
-
67
-
68
-
69
-
70
-
71
-
72
-
73
-
74
-
75
-
76
-
77
-
78
-
79
-
80
-
81
-
 82
82 -
 83
83 -
 84
84 -
 85
85 -
 86
86 -
 87
87 -
 88
88 -
 89
89 -
 90
90 -
 91
91 -
 92
92 -
 93
93 -
 94
94 -
 95
95 -
 96
96 -
 97
97 -
 98
98 -
 99
99 -
 100
100 -
 101
101 -
 102
102 -
103
-
104
-
105
-
106
-
107
-
108
-
109
-
110
-
111
-
112
-
113
-
114
-
115
-
116
-
117
-
118
-
119
-
120
-
121
-
122
-
123
-
124
-
125
-
126
-
127
-
128
-
129
-
130
-
131
-
132
-
133
-
134
-
135
-
136
-
137
-
138
-
139
-
140
-
141
-
142
-
143
-
144
-
145
-
146
-
147
-
148
-
149
-
150
-
151
-
152
-
153
-
154
-
155
-
156
-
157
-
158
-
159
-
160
-
161
-
162
-
163
-
164
-
165
-
166
-
167
-
168
-
169
-
170
-
171
-
172
-
173
-
174
-
175
-
176
-
177
-
178
-
179
-
180
-
181
-
182
-
183
-
184
-
185
-
186
-
187
-
188
-
189
-
190
-
191
-
192
-
193
-
194
-
195
-
196
-
197
-
198
-
199
-
200
-
201
-
202
-
203
-
204
-
205
-
206
-
207
-
208
-
209
-
210
-
211
-
212
-
213
-
214
-
215
-
216
-
217
-
218
-
219
-
220
-
221
-
222
-
223
-
224
-
225
-
226
-
227
-
228
 |
 |
72
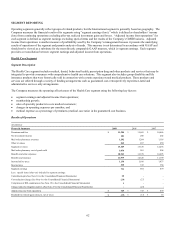
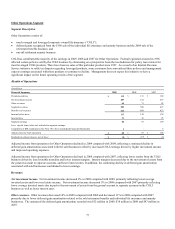
During the second quarter of 2009, the Company’s International segment implemented a capital management strategy to permanently
invest the earnings of its South Korean operation overseas. Income taxes for this operation will therefore be recorded at the tax rate of
the foreign jurisdiction. The International segment’s adjusted income from operations reflected favorable tax adjustments of $14
million from the implementation of this strategy for 2009. In addition to the implementation effect, adjusted income from operations
also reflects $8 million from the ongoing impact of the lower tax rate on the permanently invested earnings for 2009. Excluding the
impact of the South Korean tax adjustments and foreign currency movements, the International segment’s adjusted income from
operations decreased 7% for 2009, compared with 2008. The decrease was primarily driven by unfavorable claims experience in the
life, accident and supplemental health insurance business and the expatriate employee benefits business. The unfavorable effects were
partially offset by revenue growth and competitively strong margins in both businesses. The impact of foreign currency movements
was calculated by comparing the reported results to what the results would have been had the exchange rates remained constant with
the prior year’s comparable period exchange rates. Special items were generally not denominated in foreign currency.
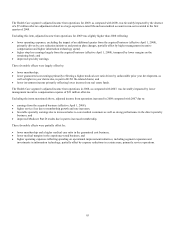
Excluding the impact of foreign currency movements noted in the table above, the International segment’s adjusted income from
operations increased 16% in 2008 compared with 2007, primarily due to continued growth in the life, accident and supplemental
health insurance business and the expatriate employee benefits business, as well as continued competitively strong margins.
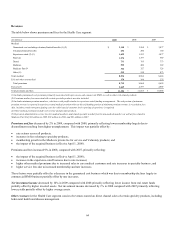
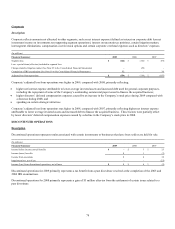
Revenues
Premiums and fees. Excluding the effect of foreign currency movements, premiums and fees were $2,042 million in 2009 compared
with reported premiums of $1,870 million in 2008, an increase of 9%. The increase was primarily attributable to new sales growth in
the life, accident and supplemental health insurance operations, particularly in South Korea, and membership growth in the expatriate
employee benefits business. Excluding the effect of foreign currency movements, premiums and fees were $1,971 million in 2008
compared with reported premiums of $1,800 million in 2007, an increase of 10%. This increase was primarily attributable to new
sales growth in the life, accident and supplemental health insurance operations, particularly in Taiwan and South Korea, and
membership growth in the expatriate employee benefits business.
To exclude the effect of foreign currency movements, premiums and fees were calculated using the prior years’ comparable period
exchange rates, allowing foreign currency neutral comparison to the prior years’ reported premiums and fees.
Net investment income decreased by 13% in 2009 compared with 2008. The decrease was primarily due to unfavorable foreign
currency movements, particularly in South Korea. Net investment income increased by 3% in 2008 compared with 2007. The
increase was primarily due to higher asset levels offset by unfavorable foreign currency movements.
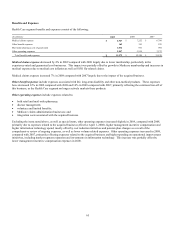
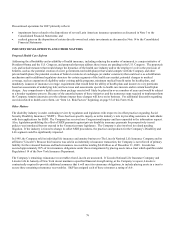
Benefits and Expenses
Benefits and expenses increased by 2% in 2009, compared with 2008. The increase was primarily driven by higher loss ratios,
business growth and increased amortization of deferred acquisition costs, partially offset by foreign currency movements.
Benefits and expenses increased by 4% in 2008 compared with 2007, primarily due to business growth in all lines of business,
partially offset by foreign currency movements, primarily in South Korea. Loss ratios decreased in 2008 in the life, accident and
supplemental health business due to favorable claims experience.
Expense ratios decreased in 2009 reflecting effective expense management. Expense ratios increased slightly in 2008 in the life,
accident and supplemental health business and the expatriate benefits business as a result of higher expenses to support growth
initiatives and expansion. Expense ratios in the life, accident and health and expatriate benefits businesses continue to be strong due
to effective expense management.
Other Items Affecting International Results
For the Company’s International segment, South Korea is the single largest geographic market. South Korea generated 29% of the
segment’s revenues and 49% of the segment’s earnings in 2009. Due to the concentration of business in South Korea, the
International segment is exposed to potential losses resulting from economic and geopolitical developments in that country, as well as
foreign currency movements affecting the South Korean currency, which could have a significant impact on the segment’s results and
the Company’s consolidated financial results.