Cigna 2009 Annual Report Download - page 189
Download and view the complete annual report
Please find page 189 of the 2009 Cigna annual report below. You can navigate through the pages in the report by either clicking on the pages listed below, or by using the keyword search tool below to find specific information within the annual report.-
 1
1 -
2
-
3
-
4
-
5
-
6
-
7
-
8
-
9
-
10
-
11
-
12
-
13
-
14
-
15
-
16
-
17
-
18
-
19
-
20
-
21
-
22
-
23
-
24
-
25
-
26
-
27
-
28
-
29
-
30
-
31
-
32
-
33
-
34
-
35
-
36
-
37
-
38
-
39
-
40
-
41
-
42
-
43
-
44
-
45
-
46
-
47
-
48
-
49
-
50
-
51
-
52
-
53
-
54
-
55
-
56
-
57
-
58
-
59
-
60
-
61
-
62
-
63
-
64
-
65
-
66
-
67
-
68
-
69
-
70
-
71
-
72
-
73
-
74
-
75
-
76
-
77
-
78
-
79
-
80
-
81
-
82
-
83
-
84
-
85
-
86
-
87
-
88
-
89
-
90
-
91
-
92
-
93
-
94
-
95
-
96
-
97
-
98
-
99
-
100
-
101
-
102
-
103
-
104
-
105
-
106
-
107
-
108
-
109
-
110
-
111
-
112
-
113
-
114
-
115
-
116
-
117
-
118
-
119
-
120
-
121
-
122
-
123
-
124
-
125
-
126
-
127
-
128
-
129
-
130
-
131
-
132
-
133
-
134
-
135
-
136
-
137
-
138
-
139
-
140
-
141
-
142
-
143
-
144
-
145
-
146
-
147
-
148
-
149
-
150
-
151
-
152
-
153
-
154
-
155
-
156
-
157
-
158
-
159
-
160
-
161
-
162
-
163
-
164
-
165
-
166
-
167
-
168
-
169
-
170
-
171
-
172
-
173
-
174
-
175
-
176
-
177
-
178
-
 179
179 -
 180
180 -
 181
181 -
 182
182 -
 183
183 -
 184
184 -
 185
185 -
 186
186 -
 187
187 -
 188
188 -
 189
189 -
 190
190 -
 191
191 -
 192
192 -
 193
193 -
 194
194 -
 195
195 -
 196
196 -
 197
197 -
 198
198 -
 199
199 -
200
-
201
-
202
-
203
-
204
-
205
-
206
-
207
-
208
-
209
-
210
-
211
-
212
-
213
-
214
-
215
-
216
-
217
-
218
-
219
-
220
-
221
-
222
-
223
-
224
-
225
-
226
-
227
-
228
 |
 |

169
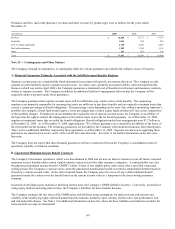
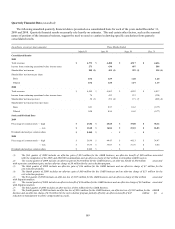
Quarterly Financial Data (unaudited)
The following unaudited quarterly financial data is presented on a consolidated basis for each of the years ended December 31,
2009 and 2008. Quarterly financial results necessarily rely heavily on estimates. This and certain other factors, such as the seasonal
nature of portions of the insurance business, suggest the need to exercise caution in drawing specific conclusions from quarterly
consolidated results.
(In millions, except per share amounts) Three Months Ended
March 31 June 30 Sept. 30 Dec. 31
Consolidated Results
2009
Total revenues $ 4,773 $ 4,488 $ 4,517 $ 4,636
Income from continuing operations before income taxes 273 630 487 508
Shareholders' net income 208 (1) 435 (2) 329 (3) 330 (4)
Shareholders' net income per share: 1
Basic 0.76 1.59 1.20 1.20
Diluted 0.76 1.58 1.19 1.19
2008
Total revenues $ 4,569 $ 4,863 $ 4,852 $ 4,817
Income from continuing operations before income taxes 74 413 233 (338)
Shareholders' net income (loss) 58 (5) 272 (6) 171 (7) (209) (8)
Shareholders' net income (loss) per share:
Basic 0.21 0.97 0.62 (0.77)
Diluted 0.20 0.96 0.62 (0.77)
Stock and Dividend Data
2009
Price range of common stock — high $ 23.06 $ 25.60 $ 33.00 $ 38.12
— low $ 12.68 $ 16.84 $ 23.10 $ 26.83
Dividends declared per common share $ 0.040 $ - $ - $ -
2008
Price range of common stock — high $ 56.98 $ 44.43 $ 44.13 $ 34.47
— low $ 36.75 $ 35.07 $ 31.76 $ 8.00
Dividends declared per common share $ 0.040 $ - $ - $ -
(1) The first quarter of 2009 includes an after-tax gain of $23 million for the GMIB business, an after-tax benefit of $20 million associated
with the completion of the 2005 and 2006 IRS examinations and an after-tax charge of $47 million to strengthen GMDB reserves.
(2) The second quarter of 2009 includes an after-tax gain of $110 million for the GMIB business, an after-tax benefit of $30 million associated
with a pension curtailment gain, and an after-tax charge of $9 million for the cost reduction program.
(3) The third quarter of 2009 includes an after-tax gain of $16 million for the GMIB business and an after-tax charge of $7 million for the
cost reduction program.
(4) The fourth quarter of 2009 includes an after-tax gain of $60 million for the GMIB business and an after-tax charge of $13 million for the
cost reduction program.
(5) The first quarter of 2008 includes an after-tax loss of $195 million for the GMIB business and an after-tax charge of $24 million associated
with litigation matters.
(6) The second quarter of 2008 includes an after-tax benefit of $34 million for the GMIB business and an after-tax charge of $52 million associated
with litigation matters.
(7) The third quarter of 2008 includes an after-tax loss of $61 million for the GMIB business.
(8) The fourth quarter of 2008 includes an after-tax loss of $215 million for the GMIB business, an after-tax loss of $192 million for the GMDB
business and an after-tax charge of $35 million for the cost reduction program partially offset by an after-tax benefit of $47 million for a
reduction in management incentive compensation accruals.