Cigna 2009 Annual Report Download - page 169
Download and view the complete annual report
Please find page 169 of the 2009 Cigna annual report below. You can navigate through the pages in the report by either clicking on the pages listed below, or by using the keyword search tool below to find specific information within the annual report.-
 1
1 -
2
-
3
-
4
-
5
-
6
-
7
-
8
-
9
-
10
-
11
-
12
-
13
-
14
-
15
-
16
-
17
-
18
-
19
-
20
-
21
-
22
-
23
-
24
-
25
-
26
-
27
-
28
-
29
-
30
-
31
-
32
-
33
-
34
-
35
-
36
-
37
-
38
-
39
-
40
-
41
-
42
-
43
-
44
-
45
-
46
-
47
-
48
-
49
-
50
-
51
-
52
-
53
-
54
-
55
-
56
-
57
-
58
-
59
-
60
-
61
-
62
-
63
-
64
-
65
-
66
-
67
-
68
-
69
-
70
-
71
-
72
-
73
-
74
-
75
-
76
-
77
-
78
-
79
-
80
-
81
-
82
-
83
-
84
-
85
-
86
-
87
-
88
-
89
-
90
-
91
-
92
-
93
-
94
-
95
-
96
-
97
-
98
-
99
-
100
-
101
-
102
-
103
-
104
-
105
-
106
-
107
-
108
-
109
-
110
-
111
-
112
-
113
-
114
-
115
-
116
-
117
-
118
-
119
-
120
-
121
-
122
-
123
-
124
-
125
-
126
-
127
-
128
-
129
-
130
-
131
-
132
-
133
-
134
-
135
-
136
-
137
-
138
-
139
-
140
-
141
-
142
-
143
-
144
-
145
-
146
-
147
-
148
-
149
-
150
-
151
-
152
-
153
-
154
-
155
-
156
-
157
-
158
-
 159
159 -
 160
160 -
 161
161 -
 162
162 -
 163
163 -
 164
164 -
 165
165 -
 166
166 -
 167
167 -
 168
168 -
 169
169 -
 170
170 -
 171
171 -
 172
172 -
 173
173 -
 174
174 -
 175
175 -
 176
176 -
 177
177 -
 178
178 -
 179
179 -
180
-
181
-
182
-
183
-
184
-
185
-
186
-
187
-
188
-
189
-
190
-
191
-
192
-
193
-
194
-
195
-
196
-
197
-
198
-
199
-
200
-
201
-
202
-
203
-
204
-
205
-
206
-
207
-
208
-
209
-
210
-
211
-
212
-
213
-
214
-
215
-
216
-
217
-
218
-
219
-
220
-
221
-
222
-
223
-
224
-
225
-
226
-
227
-
228
 |
 |

149
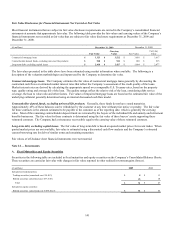
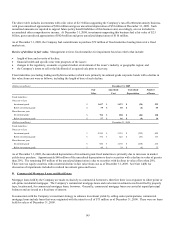
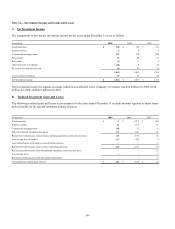
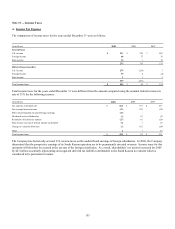
Note 14— Investment Income and Gains and Losses
A. Net Investment Income
The components of pre-tax net investment income for the years ended December 31 were as follows:
(In millions) 2009 2008 2007
Fixed maturities $ 748 $ 729 $ 722
Equity securities 7 8 8
Commercial mortgage loans 223 219 240
Policy loans 92 86 81
Real estate (1) 1 5
Other long-term investments (30) 6 24
Short-term investments and cash 10 43 78
1,049 1,092 1,158
Less investment expenses 35 29 44
Net investment income $ 1,014 $ 1,063 $ 1,114
Net investment income for separate accounts (which is not reflected in the Company’s revenues) was $22 million for 2009, $148
million for 2008, and $215 million for 2007.
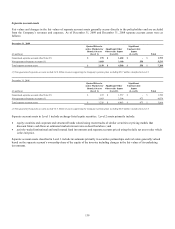
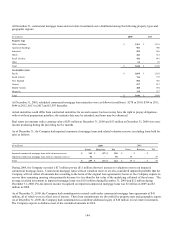
B. Realized Investment Gains and Losses
The following realized gains and losses on investments for the years ended December 31 exclude amounts required to adjust future
policy benefits for the run-off settlement annuity business.
(In millions) 2009 2008 2007
Fixed maturities $ 2 $ (237) $ (26)
Equity securities 12 (31) 13
Commercial mortgage loans (20) (2) 8
Other investments, including derivatives (37) 100 21
Realized investment gains (losses) from continuing operations, before income taxes (43) (170) 16
Less income taxes (benefits) (17) (60) 5
Less realized gains attributable to noncontrolling interests - - 1
Realized investment gains (losses) from continuing operations (26) (110) 10
Realized investment gains from discontinued operations, before income taxes - - 25
Less income taxes - - 9
Realized investment gains from discontinued operations - - 16
Net realized investment gains (losses) $ (26) $ (110) $ 26