Cigna 2009 Annual Report Download - page 181
Download and view the complete annual report
Please find page 181 of the 2009 Cigna annual report below. You can navigate through the pages in the report by either clicking on the pages listed below, or by using the keyword search tool below to find specific information within the annual report.-
 1
1 -
2
-
3
-
4
-
5
-
6
-
7
-
8
-
9
-
10
-
11
-
12
-
13
-
14
-
15
-
16
-
17
-
18
-
19
-
20
-
21
-
22
-
23
-
24
-
25
-
26
-
27
-
28
-
29
-
30
-
31
-
32
-
33
-
34
-
35
-
36
-
37
-
38
-
39
-
40
-
41
-
42
-
43
-
44
-
45
-
46
-
47
-
48
-
49
-
50
-
51
-
52
-
53
-
54
-
55
-
56
-
57
-
58
-
59
-
60
-
61
-
62
-
63
-
64
-
65
-
66
-
67
-
68
-
69
-
70
-
71
-
72
-
73
-
74
-
75
-
76
-
77
-
78
-
79
-
80
-
81
-
82
-
83
-
84
-
85
-
86
-
87
-
88
-
89
-
90
-
91
-
92
-
93
-
94
-
95
-
96
-
97
-
98
-
99
-
100
-
101
-
102
-
103
-
104
-
105
-
106
-
107
-
108
-
109
-
110
-
111
-
112
-
113
-
114
-
115
-
116
-
117
-
118
-
119
-
120
-
121
-
122
-
123
-
124
-
125
-
126
-
127
-
128
-
129
-
130
-
131
-
132
-
133
-
134
-
135
-
136
-
137
-
138
-
139
-
140
-
141
-
142
-
143
-
144
-
145
-
146
-
147
-
148
-
149
-
150
-
151
-
152
-
153
-
154
-
155
-
156
-
157
-
158
-
159
-
160
-
161
-
162
-
163
-
164
-
165
-
166
-
167
-
168
-
169
-
170
-
 171
171 -
 172
172 -
 173
173 -
 174
174 -
 175
175 -
 176
176 -
 177
177 -
 178
178 -
 179
179 -
 180
180 -
 181
181 -
 182
182 -
 183
183 -
 184
184 -
 185
185 -
 186
186 -
 187
187 -
 188
188 -
 189
189 -
 190
190 -
 191
191 -
192
-
193
-
194
-
195
-
196
-
197
-
198
-
199
-
200
-
201
-
202
-
203
-
204
-
205
-
206
-
207
-
208
-
209
-
210
-
211
-
212
-
213
-
214
-
215
-
216
-
217
-
218
-
219
-
220
-
221
-
222
-
223
-
224
-
225
-
226
-
227
-
228
 |
 |

161
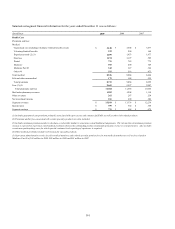
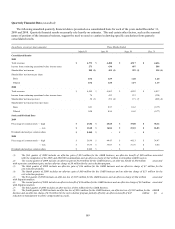
Summarized segment financial information for the years ended December 31 was as follows:
(In millions) 2009 2008 2007
Health Care
Premiums and fees:
Medical:
Guaranteed cost excluding voluntary / limited benefits (1),(2) $ 3,148 $ 3,504 $ 3,877
Voluntary/limited benefits 232 200 160
Experience-rated (2),(3) 1,699 1,953 1,877
Stop loss 1,274 1,197 589
Dental 731 785 773
Medicare 595 400 349
Medicare Part D 342 327 326
Other (4) 515 518 473
Total medical 8,536 8,884 8,424
Life and other non-medical 179 184 235
Total premiums 8,715 9,068 8,659
Fees (2),(5) 2,669 2,597 2,007
Total premiums and fees 11,384 11,665 10,666
Mail order pharmacy revenues 1,282 1,204 1,118
Other revenues 262 267 250
Net investment income 181 200 202
Segment revenues $ 13,109 $ 13,336 $ 12,236
Income taxes $ 399 $ 352 $ 358
Segment earnings $ 731 $ 664 $ 679
(1) Includes guaranteed cost premiums primarily associated with open access and commercial HMO, as well as other risk-related products.
(2) Premiums and/or fees associated with certain specialty products are also included.
(3) Includes minimum premium members who have a risk profile similar to experience-rated funding arrangements. The risk portion of minimum premium
revenue is reported in experience-rated medical premium whereas the self funding portion of minimum premium revenue is recorded in fees. Also includes
certain non-participating cases for which special customer level reporting of experience is required.
(4) Other medical premiums include risk revenue for specialty products.
(5) Represents administrative service fees for medical members and related specialty product fees for non-medical members as well as fees related to
Medicare Part D of $41 million in 2009, $69 million in 2008 and $61 million in 2007.