Cigna 2009 Annual Report Download - page 110
Download and view the complete annual report
Please find page 110 of the 2009 Cigna annual report below. You can navigate through the pages in the report by either clicking on the pages listed below, or by using the keyword search tool below to find specific information within the annual report.-
 1
1 -
2
-
3
-
4
-
5
-
6
-
7
-
8
-
9
-
10
-
11
-
12
-
13
-
14
-
15
-
16
-
17
-
18
-
19
-
20
-
21
-
22
-
23
-
24
-
25
-
26
-
27
-
28
-
29
-
30
-
31
-
32
-
33
-
34
-
35
-
36
-
37
-
38
-
39
-
40
-
41
-
42
-
43
-
44
-
45
-
46
-
47
-
48
-
49
-
50
-
51
-
52
-
53
-
54
-
55
-
56
-
57
-
58
-
59
-
60
-
61
-
62
-
63
-
64
-
65
-
66
-
67
-
68
-
69
-
70
-
71
-
72
-
73
-
74
-
75
-
76
-
77
-
78
-
79
-
80
-
81
-
82
-
83
-
84
-
85
-
86
-
87
-
88
-
89
-
90
-
91
-
92
-
93
-
94
-
95
-
96
-
97
-
98
-
99
-
 100
100 -
 101
101 -
 102
102 -
 103
103 -
 104
104 -
 105
105 -
 106
106 -
 107
107 -
 108
108 -
 109
109 -
 110
110 -
 111
111 -
 112
112 -
 113
113 -
 114
114 -
 115
115 -
 116
116 -
 117
117 -
 118
118 -
 119
119 -
 120
120 -
121
-
122
-
123
-
124
-
125
-
126
-
127
-
128
-
129
-
130
-
131
-
132
-
133
-
134
-
135
-
136
-
137
-
138
-
139
-
140
-
141
-
142
-
143
-
144
-
145
-
146
-
147
-
148
-
149
-
150
-
151
-
152
-
153
-
154
-
155
-
156
-
157
-
158
-
159
-
160
-
161
-
162
-
163
-
164
-
165
-
166
-
167
-
168
-
169
-
170
-
171
-
172
-
173
-
174
-
175
-
176
-
177
-
178
-
179
-
180
-
181
-
182
-
183
-
184
-
185
-
186
-
187
-
188
-
189
-
190
-
191
-
192
-
193
-
194
-
195
-
196
-
197
-
198
-
199
-
200
-
201
-
202
-
203
-
204
-
205
-
206
-
207
-
208
-
209
-
210
-
211
-
212
-
213
-
214
-
215
-
216
-
217
-
218
-
219
-
220
-
221
-
222
-
223
-
224
-
225
-
226
-
227
-
228
 |
 |

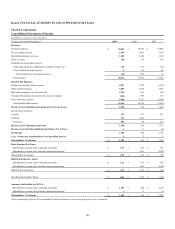
90
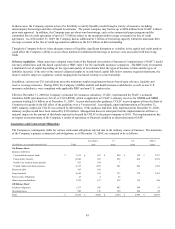
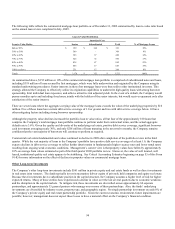
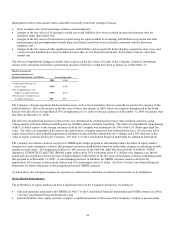
The following table reflects the commercial mortgage loan portfolio as of December 31, 2009 summarized by loan to value ratio based
on the annual loan review completed in July, 2009.
Loan to Value Distribution
Amortized Cost
Loan to Value Ratios Senior Subordinated Total % of Mortgage Loans
Below 50% $ 199 $ 164 $ 363 10%
50% to 59% 309 - 309 9%
60% to 69% 383 37 420 12%
70% to 79% 524 72 596 17%
80% to 89% 838 47 885 25%
90% to 99% 666 17 683 19%
100% or above 251 15 266 8%
Totals $ 3,170 $ 352 $ 3,522 100%
As summarized above, $352 million or 10% of the commercial mortgage loan portfolio is comprised of subordinated notes and loans,
including $319 million of loans secured by first mortgages, which were fully underwritten and originated by the Company using its
standard underwriting procedures. Senior interests in these first mortgage loans were then sold to other institutional investors. This
strategy allowed the Company to effectively utilize its origination capabilities to underwrite high quality loans with strong borrower
sponsorship, limit individual loan exposures, and achieve attractive risk adjusted yields. In the event of a default, the Company would
pursue remedies up to and including foreclosure jointly with the holders of the senior interests, but would receive repayment only after
satisfaction of the senior interest.
There are seven loans where the aggregate carrying value of the mortgage loans exceeds the value of the underlying properties by $16
million. Five of these loans have current debt service coverage of 1.0 or greater and two with debt service coverage below 1.0 have
other mitigating factors including strong borrower sponsorship.
Although the property value declines increased the portfolio loan to value ratios, all but four of the approximately 180 loans that
comprise the Company’s total mortgage loan portfolio continue to perform under their contractual terms, and the actual aggregate
default rate is 3.6%. Given the quality and diversity of the underlying real estate, positive debt service coverage, significant borrower
cash investment averaging nearly 30%, and only $201 million of loans maturing in the next twelve months, the Company remains
confident that the vast majority of borrowers will continue to perform as required.
Commercial real estate fundamentals and values continued to decline in 2009 after completion of the portfolio review in the third
quarter. While the vast majority of loans in the Company’s portfolio have positive debt service coverage of at least 1.0, the Company
expects declines in debt service coverage to reflect further deterioration in fundamentals (higher vacancy rates and lower rental rates)
resulting from ongoing weak economic conditions. Management’s current view is that property values have fallen by approximately
10% on average from values estimated as part of the third quarter 2009 portfolio review. However, the value of well located, well
leased, institutional quality real estate appears to be stabilizing. See Critical Accounting Estimates beginning on page 55 of this Form
10-K for more information on the effect of declines in property values on commercial mortgage loans.
Other Long-term Investments
The Company’s other long-term investments include $561 million in private equity and real estate funds as well as direct investments
in real estate joint ventures. The funds typically invest in mezzanine debt or equity of privately held companies and equity real estate.
Because these investments have a subordinate position in the capital structure, the Company assumes a higher level of risk for higher
expected returns. Many of these entities have experienced a decline in value over the last several quarters due to economic weakness
and the disruption in the capital markets. To mitigate risk, these investments are diversified across approximately 60 separate
partnerships, and approximately 35 general partners who manage one or more of these partnerships. Also, the funds’ underlying
investments are diversified by industry sector, property type, and geographic region. No single partnership investment exceeds 8% of
the Company’s private equity and real estate partnership portfolio. Given the current economic environment, future impairments are
possible; however, management does not expect those losses to have a material effect on the Company’s financial condition.