Cigna 2009 Annual Report Download - page 179
Download and view the complete annual report
Please find page 179 of the 2009 Cigna annual report below. You can navigate through the pages in the report by either clicking on the pages listed below, or by using the keyword search tool below to find specific information within the annual report.-
 1
1 -
2
-
3
-
4
-
5
-
6
-
7
-
8
-
9
-
10
-
11
-
12
-
13
-
14
-
15
-
16
-
17
-
18
-
19
-
20
-
21
-
22
-
23
-
24
-
25
-
26
-
27
-
28
-
29
-
30
-
31
-
32
-
33
-
34
-
35
-
36
-
37
-
38
-
39
-
40
-
41
-
42
-
43
-
44
-
45
-
46
-
47
-
48
-
49
-
50
-
51
-
52
-
53
-
54
-
55
-
56
-
57
-
58
-
59
-
60
-
61
-
62
-
63
-
64
-
65
-
66
-
67
-
68
-
69
-
70
-
71
-
72
-
73
-
74
-
75
-
76
-
77
-
78
-
79
-
80
-
81
-
82
-
83
-
84
-
85
-
86
-
87
-
88
-
89
-
90
-
91
-
92
-
93
-
94
-
95
-
96
-
97
-
98
-
99
-
100
-
101
-
102
-
103
-
104
-
105
-
106
-
107
-
108
-
109
-
110
-
111
-
112
-
113
-
114
-
115
-
116
-
117
-
118
-
119
-
120
-
121
-
122
-
123
-
124
-
125
-
126
-
127
-
128
-
129
-
130
-
131
-
132
-
133
-
134
-
135
-
136
-
137
-
138
-
139
-
140
-
141
-
142
-
143
-
144
-
145
-
146
-
147
-
148
-
149
-
150
-
151
-
152
-
153
-
154
-
155
-
156
-
157
-
158
-
159
-
160
-
161
-
162
-
163
-
164
-
165
-
166
-
167
-
168
-
 169
169 -
 170
170 -
 171
171 -
 172
172 -
 173
173 -
 174
174 -
 175
175 -
 176
176 -
 177
177 -
 178
178 -
 179
179 -
 180
180 -
 181
181 -
 182
182 -
 183
183 -
 184
184 -
 185
185 -
 186
186 -
 187
187 -
 188
188 -
 189
189 -
190
-
191
-
192
-
193
-
194
-
195
-
196
-
197
-
198
-
199
-
200
-
201
-
202
-
203
-
204
-
205
-
206
-
207
-
208
-
209
-
210
-
211
-
212
-
213
-
214
-
215
-
216
-
217
-
218
-
219
-
220
-
221
-
222
-
223
-
224
-
225
-
226
-
227
-
228
 |
 |

159
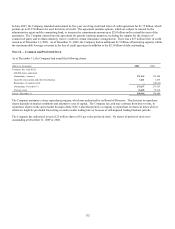
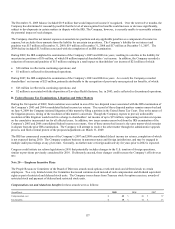
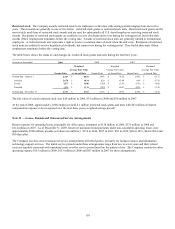
Restricted stock. The Company awards restricted stock to its employees or directors with vesting periods ranging from one to five
years. These awards are generally in one of two forms: restricted stock grants or restricted stock units. Restricted stock grants are the
most widely used form of restricted stock awards and are used for substantially all U.S.-based employees receiving restricted stock
awards. Recipients of restricted stock grants are entitled to receive dividends and to vote during the vesting period, but forfeit their
awards if their employment terminates before the vesting date. Awards of restricted stock units are generally limited to international
employees. A restricted stock unit represents a right to receive a common share of stock when the unit vests. Recipients of restricted
stock units are entitled to receive hypothetical dividends, but cannot vote during the vesting period. They forfeit their units if their
employment terminates before the vesting date.
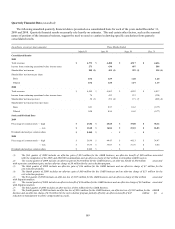
The table below shows the status of, and changes in, restricted stock grants and units during the last three years:
(Awards in thousands) 2009 2008 2007
Weighted Weighted Weighted
Average Fair Value Average Fair Value Average Fair Value
Grants/Units at Award Date Grants/Units at Award Date Grants/Units at Award Date
Outstanding - January 1 2,347 $ 40.53 2,482 $ 34.28 2,802 $ 26.72
Awarded 2,678 $ 18.14 820 $ 43.90 698 $ 47.20
Vested (557) $ 32.00 (760) $ 23.81 (750) $ 19.06
Forfeited (355) $ 33.79 (195) $ 40.47 (268) $ 31.45
Outstanding - December 31 4,113 $ 27.65 2,347 $ 40.53 2,482 $ 34.28
The fair value of vested restricted stock was: $10 million in 2009, $35 million in 2008 and $36 million in 2007.
At the end of 2009, approximately 2,880 employees held 4.1 million restricted stock grants and units with $63 million of related
compensation expense to be recognized over the next three years (weighted average period).
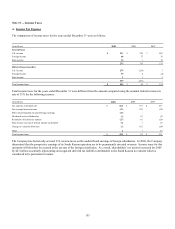
Note 21 — Leases, Rentals and Outsourced Service Arrangements
Rental expenses for operating leases, principally for office space, amounted to $138 million in 2009, $131 million in 2008 and
$114 million in 2007. As of December 31, 2009, future net minimum rental payments under non-cancelable operating leases were
approximately $500 million, payable as follows (in millions): $116 in 2010, $107 in 2011, $83 in 2012, $60 in 2013, $44 in 2014 and
$90 thereafter.
The Company also has several outsourced service arrangements with third parties, primarily for human resource and information
technology support services. The initial service periods under these arrangements range from two to seven years and their related
costs are reported consistent with operating leases over the service period based on the pattern of use. The Company recorded in other
operating expense $115 million in 2009, $113 million in 2008 and $87 million in 2007 for these arrangements.