Cigna 2009 Annual Report Download - page 82
Download and view the complete annual report
Please find page 82 of the 2009 Cigna annual report below. You can navigate through the pages in the report by either clicking on the pages listed below, or by using the keyword search tool below to find specific information within the annual report.-
 1
1 -
2
-
3
-
4
-
5
-
6
-
7
-
8
-
9
-
10
-
11
-
12
-
13
-
14
-
15
-
16
-
17
-
18
-
19
-
20
-
21
-
22
-
23
-
24
-
25
-
26
-
27
-
28
-
29
-
30
-
31
-
32
-
33
-
34
-
35
-
36
-
37
-
38
-
39
-
40
-
41
-
42
-
43
-
44
-
45
-
46
-
47
-
48
-
49
-
50
-
51
-
52
-
53
-
54
-
55
-
56
-
57
-
58
-
59
-
60
-
61
-
62
-
63
-
64
-
65
-
66
-
67
-
68
-
69
-
70
-
71
-
 72
72 -
 73
73 -
 74
74 -
 75
75 -
 76
76 -
 77
77 -
 78
78 -
 79
79 -
 80
80 -
 81
81 -
 82
82 -
 83
83 -
 84
84 -
 85
85 -
 86
86 -
 87
87 -
 88
88 -
 89
89 -
 90
90 -
 91
91 -
 92
92 -
93
-
94
-
95
-
96
-
97
-
98
-
99
-
100
-
101
-
102
-
103
-
104
-
105
-
106
-
107
-
108
-
109
-
110
-
111
-
112
-
113
-
114
-
115
-
116
-
117
-
118
-
119
-
120
-
121
-
122
-
123
-
124
-
125
-
126
-
127
-
128
-
129
-
130
-
131
-
132
-
133
-
134
-
135
-
136
-
137
-
138
-
139
-
140
-
141
-
142
-
143
-
144
-
145
-
146
-
147
-
148
-
149
-
150
-
151
-
152
-
153
-
154
-
155
-
156
-
157
-
158
-
159
-
160
-
161
-
162
-
163
-
164
-
165
-
166
-
167
-
168
-
169
-
170
-
171
-
172
-
173
-
174
-
175
-
176
-
177
-
178
-
179
-
180
-
181
-
182
-
183
-
184
-
185
-
186
-
187
-
188
-
189
-
190
-
191
-
192
-
193
-
194
-
195
-
196
-
197
-
198
-
199
-
200
-
201
-
202
-
203
-
204
-
205
-
206
-
207
-
208
-
209
-
210
-
211
-
212
-
213
-
214
-
215
-
216
-
217
-
218
-
219
-
220
-
221
-
222
-
223
-
224
-
225
-
226
-
227
-
228
 |
 |

62
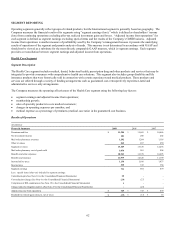
SEGMENT REPORTING
Operating segments generally reflect groups of related products, but the International segment is generally based on geography. The
Company measures the financial results of its segments using “segment earnings (loss),” which is defined as shareholders’ income
(loss) from continuing operations excluding after-tax realized investment gains and losses. “Adjusted income from operations” for
each segment is defined as segment earnings excluding special items and the results of the Company’s GMIB business. Adjusted
income from operations is another measure of profitability used by the Company’s management because it presents the underlying
results of operations of the segment and permits analysis of trends. This measure is not determined in accordance with GAAP and
should not be viewed as a substitute for the most directly comparable GAAP measure, which is segment earnings. Each segment
provides a reconciliation between segment earnings and adjusted income from operations.
Health Care Segment
Segment Description
The Health Care segment includes medical, dental, behavioral health, prescription drug and other products and services that may be
integrated to provide consumers with comprehensive health care solutions. This segment also includes group disability and life
insurance products that were historically sold in connection with certain experience-rated medical products. These products and
services are offered through a variety of funding arrangements such as guaranteed cost, retrospectively experience-rated and
administrative services only arrangements.
The Company measures the operating effectiveness of the Health Care segment using the following key factors:
x segment earnings and adjusted income from operations;
x membership growth;
x sales of specialty products to core medical customers;
x changes in operating expenses per member; and
x medical expense as a percentage of premiums (medical care ratio) in the guaranteed cost business.
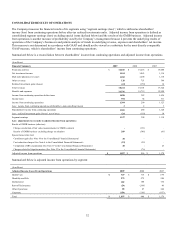
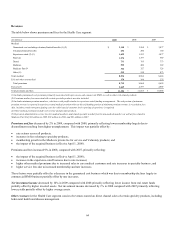
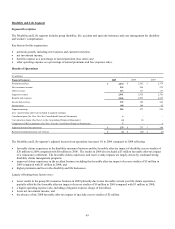
Results of Operations
(In millions)
Financial Summary 2009 2008 2007
Premiums and fees $ 11,384 $ 11,665 $ 10,666
Net investment income 181 200 202
Mail order pharmacy revenues 1,282 1,204 1,118
Other revenues 262 267 250
Segment revenues 13,109 13,336 12,236
Mail order pharmacy cost of goods sold 1,036 961 904
Benefits and other expenses 10,943 11,359 10,295
Benefits and expenses 11,979 12,320 11,199
Income before taxes 1,130 1,016 1,037
Income taxes 399 352 358
Segment earnings 731 664 679
Less: special items (after-tax) included in segment earnings:
Curtailment gain (See Note 10 to the Consolidated Financial Statements) 25 - -
Cost reduction charge (See Note 6 to the Consolidated Financial Statements) (24) (27) -
Completion of IRS examination (See Note 19 to the Consolidated Financial Statements) 1 - -
Charge related to litigation matters (See Note 23 to the Consolidated Financial Statements) - (24) -
Adjusted income from operations $ 729 $ 715 $ 679
Realized investment gains (losses), net of taxes $(19) $(13) $ 14