Cigna 2009 Annual Report Download - page 93
Download and view the complete annual report
Please find page 93 of the 2009 Cigna annual report below. You can navigate through the pages in the report by either clicking on the pages listed below, or by using the keyword search tool below to find specific information within the annual report.-
 1
1 -
2
-
3
-
4
-
5
-
6
-
7
-
8
-
9
-
10
-
11
-
12
-
13
-
14
-
15
-
16
-
17
-
18
-
19
-
20
-
21
-
22
-
23
-
24
-
25
-
26
-
27
-
28
-
29
-
30
-
31
-
32
-
33
-
34
-
35
-
36
-
37
-
38
-
39
-
40
-
41
-
42
-
43
-
44
-
45
-
46
-
47
-
48
-
49
-
50
-
51
-
52
-
53
-
54
-
55
-
56
-
57
-
58
-
59
-
60
-
61
-
62
-
63
-
64
-
65
-
66
-
67
-
68
-
69
-
70
-
71
-
72
-
73
-
74
-
75
-
76
-
77
-
78
-
79
-
80
-
81
-
82
-
 83
83 -
 84
84 -
 85
85 -
 86
86 -
 87
87 -
 88
88 -
 89
89 -
 90
90 -
 91
91 -
 92
92 -
 93
93 -
 94
94 -
 95
95 -
 96
96 -
 97
97 -
 98
98 -
 99
99 -
 100
100 -
 101
101 -
 102
102 -
 103
103 -
104
-
105
-
106
-
107
-
108
-
109
-
110
-
111
-
112
-
113
-
114
-
115
-
116
-
117
-
118
-
119
-
120
-
121
-
122
-
123
-
124
-
125
-
126
-
127
-
128
-
129
-
130
-
131
-
132
-
133
-
134
-
135
-
136
-
137
-
138
-
139
-
140
-
141
-
142
-
143
-
144
-
145
-
146
-
147
-
148
-
149
-
150
-
151
-
152
-
153
-
154
-
155
-
156
-
157
-
158
-
159
-
160
-
161
-
162
-
163
-
164
-
165
-
166
-
167
-
168
-
169
-
170
-
171
-
172
-
173
-
174
-
175
-
176
-
177
-
178
-
179
-
180
-
181
-
182
-
183
-
184
-
185
-
186
-
187
-
188
-
189
-
190
-
191
-
192
-
193
-
194
-
195
-
196
-
197
-
198
-
199
-
200
-
201
-
202
-
203
-
204
-
205
-
206
-
207
-
208
-
209
-
210
-
211
-
212
-
213
-
214
-
215
-
216
-
217
-
218
-
219
-
220
-
221
-
222
-
223
-
224
-
225
-
226
-
227
-
228
 |
 |

73
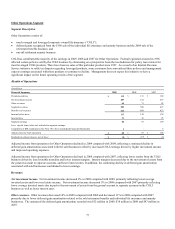
Run-off Reinsurance Segment
Segment Description
The Company’s reinsurance operations were discontinued and are now an inactive business in run-off mode since the sale of the U.S.
individual life, group life and accidental death reinsurance business in 2000. This segment is predominantly comprised of GMDB,
GMIB, workers’ compensation and personal accident reinsurance products.
The determination of liabilities for GMDB and GMIB requires the Company to make critical accounting estimates. In 2008, the
Company updated the assumptions for GMIB and the effects of hypothetical changes in those assumptions in connection with the
implementation of the FASB’s fair value disclosure and measurement guidance (ASC 820). The Company describes the assumptions
used to develop the reserves for GMDB in Note 7 to the Consolidated Financial Statements and for the assets and liabilities associated
with GMIB in Note 11 to the Consolidated Financial Statements. The Company also provides the effects of hypothetical changes in
those assumptions in the Critical Accounting Estimates section of the MD&A beginning on page 55 of this Form 10-K.
The Company excludes the results of the GMIB business from adjusted income from operations because the fair value of GMIB assets
and liabilities must be recalculated each quarter using updated capital market assumptions. The resulting changes in fair value, which
are reported in shareholders’ net income, are volatile and unpredictable. See the “Critical Accounting Estimates” section of the
MD&A beginning on page 55 of this Form 10-K for more information on the effect of capital market assumption changes on
shareholders’ net income.
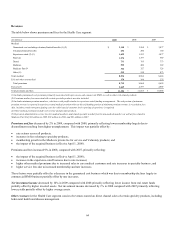
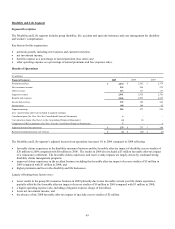
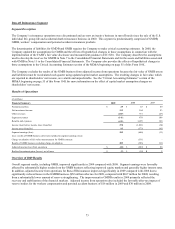
Results of Operations
(In millions)
Financial Summary 2009 2008 2007
Premiums and fees $ 29 $ 43 $ 60
Net investment income 113 104 93
Other revenues (283) 331 (47)
Segment revenues (141) 478 106
Benefits and expenses (419) 1,499 160
Income (loss) before income taxes (benefits) 278 (1,021) (54)
Income taxes (benefits) 93 (375) (43)
Segment earnings (loss) 185 (646) (11)
Less: results of GMIB business (after-tax) included in segment earnings (loss):
Charge on adoption of fair value measurements for GMIB contracts - (131) -
Results of GMIB business excluding charge on adoption 209 (306) (91)
Adjusted income (loss) from operations $(24) $ (209) $ 80
Realized investment gains (losses), net of taxes $(2) $ (19) $ 2
Overview of 2009 Results
Overall segment results, including GMIB, improved significantly in 2009 compared with 2008. Segment earnings were favorably
affected by substantially higher results from the GMIB business reflecting improved equity markets and generally higher interest rates.
In addition, adjusted income from operations for Run-off Reinsurance improved significantly in 2009 compared with 2008 due to
significantly reduced losses in the GMDB business ($52 million after-tax for 2009, compared with $267 million for 2008) resulting
from a substantially lower amount of reserve strengthening. The improvement in GMDB results in 2009 primarily reflected the
recovery and stabilization of the financial markets. Adjusted income from operations also included the favorable after-tax impact of
reserve studies for the workers compensation and personal accident business of $16 million in 2009 and $30 million in 2008.