Cigna 2009 Annual Report Download - page 109
Download and view the complete annual report
Please find page 109 of the 2009 Cigna annual report below. You can navigate through the pages in the report by either clicking on the pages listed below, or by using the keyword search tool below to find specific information within the annual report.-
 1
1 -
2
-
3
-
4
-
5
-
6
-
7
-
8
-
9
-
10
-
11
-
12
-
13
-
14
-
15
-
16
-
17
-
18
-
19
-
20
-
21
-
22
-
23
-
24
-
25
-
26
-
27
-
28
-
29
-
30
-
31
-
32
-
33
-
34
-
35
-
36
-
37
-
38
-
39
-
40
-
41
-
42
-
43
-
44
-
45
-
46
-
47
-
48
-
49
-
50
-
51
-
52
-
53
-
54
-
55
-
56
-
57
-
58
-
59
-
60
-
61
-
62
-
63
-
64
-
65
-
66
-
67
-
68
-
69
-
70
-
71
-
72
-
73
-
74
-
75
-
76
-
77
-
78
-
79
-
80
-
81
-
82
-
83
-
84
-
85
-
86
-
87
-
88
-
89
-
90
-
91
-
92
-
93
-
94
-
95
-
96
-
97
-
98
-
 99
99 -
 100
100 -
 101
101 -
 102
102 -
 103
103 -
 104
104 -
 105
105 -
 106
106 -
 107
107 -
 108
108 -
 109
109 -
 110
110 -
 111
111 -
 112
112 -
 113
113 -
 114
114 -
 115
115 -
 116
116 -
 117
117 -
 118
118 -
 119
119 -
120
-
121
-
122
-
123
-
124
-
125
-
126
-
127
-
128
-
129
-
130
-
131
-
132
-
133
-
134
-
135
-
136
-
137
-
138
-
139
-
140
-
141
-
142
-
143
-
144
-
145
-
146
-
147
-
148
-
149
-
150
-
151
-
152
-
153
-
154
-
155
-
156
-
157
-
158
-
159
-
160
-
161
-
162
-
163
-
164
-
165
-
166
-
167
-
168
-
169
-
170
-
171
-
172
-
173
-
174
-
175
-
176
-
177
-
178
-
179
-
180
-
181
-
182
-
183
-
184
-
185
-
186
-
187
-
188
-
189
-
190
-
191
-
192
-
193
-
194
-
195
-
196
-
197
-
198
-
199
-
200
-
201
-
202
-
203
-
204
-
205
-
206
-
207
-
208
-
209
-
210
-
211
-
212
-
213
-
214
-
215
-
216
-
217
-
218
-
219
-
220
-
221
-
222
-
223
-
224
-
225
-
226
-
227
-
228
 |
 |

89
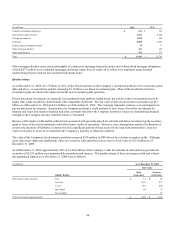
As of December 31, 2009, approximately 79% or $428 million of the Company’s total investments in other asset-backed securities of
$541 million were guaranteed by monoline bond insurers. All of these securities had quality ratings of Baa2 or better. Quality ratings
without considering the guarantees for these other asset-backed securities were not available.
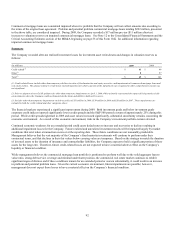
As of December 31, 2009, the Company had no direct investments in monoline bond insurers. Guarantees provided by various
monoline bond insurers for certain of the Company’s investments in state and local governments and other asset-backed securities as
of December 31, 2009 were:
(In millions) As of December 31, 2009
Guarantor
Guarantor Quality
Rating Indirect Exposure
AMBAC Caa2 $ 196
MBIA, Inc. Baa1 1,204
Financial Securities Assurance Aa3 594
Financial Guaranty Insurance Co. Not rated 39
Total $ 2,033
The Company continues to underwrite investments in these securities focusing on the underlying issuer’s credit quality, without regard
for guarantees. As such, this portfolio of state and local government securities, guaranteed by monoline bond insurers is of high
quality with approximately 92% rated A3 or better without their guarantees.
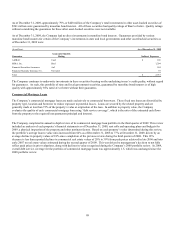
Commercial Mortgage Loans
The Company’s commercial mortgage loans are made exclusively to commercial borrowers. These fixed rate loans are diversified by
property type, location and borrower to reduce exposure to potential losses. Loans are secured by the related property and are
generally made at less than 75% of the property’s value at origination of the loan. In addition to property value, the Company
evaluates the quality of each commercial mortgage loan using “debt service coverage”, which is the ratio of the estimated cash flows
from the property to the required loan payments (principal and interest).
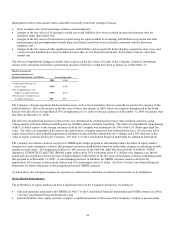
The Company completed its annual in depth review of its commercial mortgage loan portfolio in the third quarter of 2009. This review
included an analysis of each property’s financial statements as of December 31, 2008, rent rolls and operating plans and budgets for
2009, a physical inspection of the property and other pertinent factors. Based on each property’s value determined during this review,
the portfolio’s average loan to value ratio increased from 64% as of December 31, 2008 to 77% at December 31, 2009, driven by an
average decline in property values of 18% since completion of the previous review during the third quarter of 2008. This 18%
decrease is less than reported declines in commercial real estate values of 20% to 30% from peak prices achieved in late 2006 and into
early 2007 to real estate values estimated during the second quarter of 2009. This was driven by management’s decision to not fully
reflect peak prices in prior valuations, along with declines in value recognized during the Company’s 2008 portfolio review. In 2009,
overall debt service coverage for the portfolio of commercial mortgage loans was approximately 1.5, which was unchanged since the
2008 portfolio review.