Cigna 2009 Annual Report Download - page 157
Download and view the complete annual report
Please find page 157 of the 2009 Cigna annual report below. You can navigate through the pages in the report by either clicking on the pages listed below, or by using the keyword search tool below to find specific information within the annual report.-
 1
1 -
2
-
3
-
4
-
5
-
6
-
7
-
8
-
9
-
10
-
11
-
12
-
13
-
14
-
15
-
16
-
17
-
18
-
19
-
20
-
21
-
22
-
23
-
24
-
25
-
26
-
27
-
28
-
29
-
30
-
31
-
32
-
33
-
34
-
35
-
36
-
37
-
38
-
39
-
40
-
41
-
42
-
43
-
44
-
45
-
46
-
47
-
48
-
49
-
50
-
51
-
52
-
53
-
54
-
55
-
56
-
57
-
58
-
59
-
60
-
61
-
62
-
63
-
64
-
65
-
66
-
67
-
68
-
69
-
70
-
71
-
72
-
73
-
74
-
75
-
76
-
77
-
78
-
79
-
80
-
81
-
82
-
83
-
84
-
85
-
86
-
87
-
88
-
89
-
90
-
91
-
92
-
93
-
94
-
95
-
96
-
97
-
98
-
99
-
100
-
101
-
102
-
103
-
104
-
105
-
106
-
107
-
108
-
109
-
110
-
111
-
112
-
113
-
114
-
115
-
116
-
117
-
118
-
119
-
120
-
121
-
122
-
123
-
124
-
125
-
126
-
127
-
128
-
129
-
130
-
131
-
132
-
133
-
134
-
135
-
136
-
137
-
138
-
139
-
140
-
141
-
142
-
143
-
144
-
145
-
146
-
 147
147 -
 148
148 -
 149
149 -
 150
150 -
 151
151 -
 152
152 -
 153
153 -
 154
154 -
 155
155 -
 156
156 -
 157
157 -
 158
158 -
 159
159 -
 160
160 -
 161
161 -
 162
162 -
 163
163 -
 164
164 -
 165
165 -
 166
166 -
 167
167 -
168
-
169
-
170
-
171
-
172
-
173
-
174
-
175
-
176
-
177
-
178
-
179
-
180
-
181
-
182
-
183
-
184
-
185
-
186
-
187
-
188
-
189
-
190
-
191
-
192
-
193
-
194
-
195
-
196
-
197
-
198
-
199
-
200
-
201
-
202
-
203
-
204
-
205
-
206
-
207
-
208
-
209
-
210
-
211
-
212
-
213
-
214
-
215
-
216
-
217
-
218
-
219
-
220
-
221
-
222
-
223
-
224
-
225
-
226
-
227
-
228
 |
 |

137
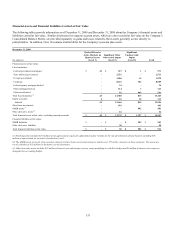
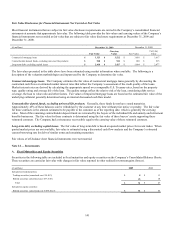
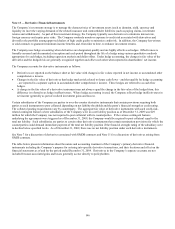
GMIB liabilities are reported in the Company’s Consolidated Balance Sheets in Accounts payable, accrued expenses and other
liabilities. GMIB assets associated with these contracts represent net receivables in connection with reinsurance that the Company has
purchased from two external reinsurers and are reported in the Company’s Consolidated Balance Sheets in Other assets, including
other intangibles. As of December 31, 2009, S&P has given a financial strength rating of AA to one reinsurer. The receivable from
the second reinsurer is fully collateralized by assets held in a trust.
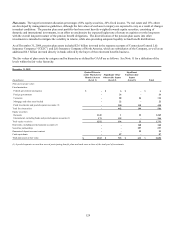
Changes in Level 3 Financial Assets and Financial Liabilities Carried at Fair Value
The following tables summarize the changes in financial assets and financial liabilities classified in Level 3 for the years ended
December 31, 2009 and 2008. These tables exclude separate account assets as changes in fair values of these assets accrue directly to
policyholders. Gains and losses reported in this table may include changes in fair value that are attributable to both observable and
unobservable inputs.
(In millions)
Fixed Maturities &
Equity Securities GMIB Assets GMIB Liabilities GMIB Net
Balance at 1/1/09 $ 889 $ 953 $ (1,757) $ (804)
Gains (losses) included in income:
Results of GMIB - (365) 669 304
Other (18) - - -
Total gains (losses) included in net income (18) (365) 669 304
Gains included in other comprehensive income 59 - - -
Losses required to adjust future policy benefits for settlement annuities (1) (72) - - -
Purchases, issuances, settlements (29) (106) 185 79
Transfers into Level 3 16 - - -
Balance at 12/31/09 $ 845 $ 482 $ (903) $ (421)
Total gains (losses) included in net income attributable to
instruments held at the reporting date $ (20) $ (365) $ 669 $ 304
(1) Amounts do not accrue to shareholders.
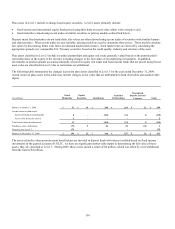
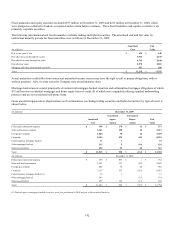
(In millions)
Fixed Maturities &
Equity Securities GMIB Assets GMIB Liabilities GMIB Net
Balance at 1/1/08 $ 732 $ 173 $ (313) $ (140)
Gains (losses) included in income:
Effect of adoption of new fair value measurement guidance - 244 (446) (202)
Results of GMIB, excluding adoption effect - 604 (1,092) (488)
Other (21) - - -
Total gains (losses) included in net income (21) 848 (1,538) (690)
Losses included in other comprehensive income (17) - - -
Gains required to adjust future policy benefits for settlement annuities (1) 91 - - -
Purchases, issuances, settlements 1 (68) 94 26
Transfers into Level 3 103 - - -
Balance at 12/31/08 $ 889 $ 953 $ (1,757) $ (804)
Total gains (losses) included in net income attributable to
instruments held at the reporting date $ (18) $ 848 $ (1,538) $ (690)
(1) Amounts do not accrue to shareholders.