Cigna 2009 Annual Report Download - page 162
Download and view the complete annual report
Please find page 162 of the 2009 Cigna annual report below. You can navigate through the pages in the report by either clicking on the pages listed below, or by using the keyword search tool below to find specific information within the annual report.-
 1
1 -
2
-
3
-
4
-
5
-
6
-
7
-
8
-
9
-
10
-
11
-
12
-
13
-
14
-
15
-
16
-
17
-
18
-
19
-
20
-
21
-
22
-
23
-
24
-
25
-
26
-
27
-
28
-
29
-
30
-
31
-
32
-
33
-
34
-
35
-
36
-
37
-
38
-
39
-
40
-
41
-
42
-
43
-
44
-
45
-
46
-
47
-
48
-
49
-
50
-
51
-
52
-
53
-
54
-
55
-
56
-
57
-
58
-
59
-
60
-
61
-
62
-
63
-
64
-
65
-
66
-
67
-
68
-
69
-
70
-
71
-
72
-
73
-
74
-
75
-
76
-
77
-
78
-
79
-
80
-
81
-
82
-
83
-
84
-
85
-
86
-
87
-
88
-
89
-
90
-
91
-
92
-
93
-
94
-
95
-
96
-
97
-
98
-
99
-
100
-
101
-
102
-
103
-
104
-
105
-
106
-
107
-
108
-
109
-
110
-
111
-
112
-
113
-
114
-
115
-
116
-
117
-
118
-
119
-
120
-
121
-
122
-
123
-
124
-
125
-
126
-
127
-
128
-
129
-
130
-
131
-
132
-
133
-
134
-
135
-
136
-
137
-
138
-
139
-
140
-
141
-
142
-
143
-
144
-
145
-
146
-
147
-
148
-
149
-
150
-
151
-
 152
152 -
 153
153 -
 154
154 -
 155
155 -
 156
156 -
 157
157 -
 158
158 -
 159
159 -
 160
160 -
 161
161 -
 162
162 -
 163
163 -
 164
164 -
 165
165 -
 166
166 -
 167
167 -
 168
168 -
 169
169 -
 170
170 -
 171
171 -
 172
172 -
173
-
174
-
175
-
176
-
177
-
178
-
179
-
180
-
181
-
182
-
183
-
184
-
185
-
186
-
187
-
188
-
189
-
190
-
191
-
192
-
193
-
194
-
195
-
196
-
197
-
198
-
199
-
200
-
201
-
202
-
203
-
204
-
205
-
206
-
207
-
208
-
209
-
210
-
211
-
212
-
213
-
214
-
215
-
216
-
217
-
218
-
219
-
220
-
221
-
222
-
223
-
224
-
225
-
226
-
227
-
228
 |
 |

142
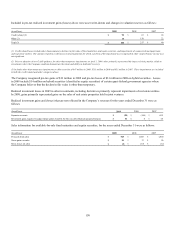
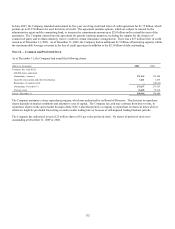
Fixed maturities and equity securities included $197 million at December 31, 2009 and $211 million at December 31, 2008, which
were pledged as collateral to brokers as required under certain futures contracts. These fixed maturities and equities securities were
primarily corporate securities.
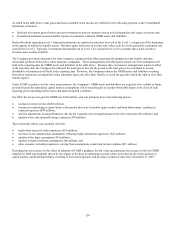
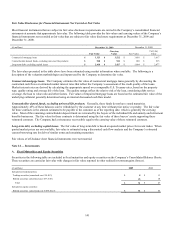
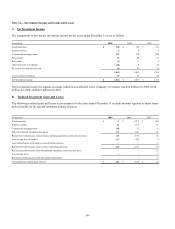
The following information about fixed maturities excludes trading and hybrid securities. The amortized cost and fair value by
contractual maturity periods for fixed maturities were as follows at December 31, 2009:
Amortized Fair
(In millions) Cost Value
Due in one year or less $ 624 $ 640
Due after one year through five years 3,923 4,155
Due after five years through ten years 4,765 5,048
Due after ten years 2,570 2,853
Mortgage and other asset-backed securities 653 696
Total $ 12,535 $ 13,392
Actual maturities could differ from contractual maturities because issuers may have the right to call or prepay obligations, with or
without penalties. Also, in some cases the Company may extend maturity dates.
Mortgage-backed assets consist principally of commercial mortgage-backed securities and collateralized mortgage obligations of which
$37 million were residential mortgages and home equity lines of credit, all of which were originated utilizing standard underwriting
practices and are not considered sub-prime loans.
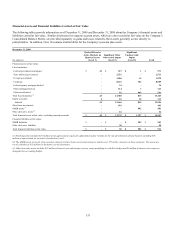
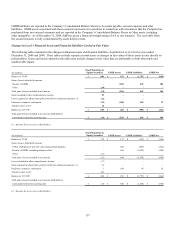
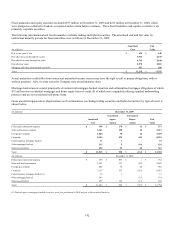
Gross unrealized appreciation (depreciation) on fixed maturities (excluding trading securities and hybrid securities) by type of issuer is
shown below.
(In millions) December 31, 2009
Unrealized Unrealized
Amortized Appre- Depre- Fair
Cost ciation ciation Value
Federal government and agency $ 398 $ 174 $ (1) $ 571
State and local government 2,341 188 (8) 2,521
Foreign government 1,040 38 (8) 1,070
Corporate 8,104 529 (98) 8,535
Federal agency mortgage-backed 33 1 - 34
Other mortgage-backed 125 5 (10) 120
Other asset-backed 494 55 (8) 541
Total $ 12,535 $ 990 $ (133) $ 13,392
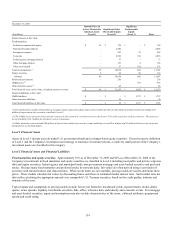
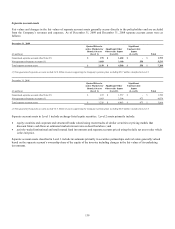
(In millions) December 31, 2008
Federal government and agency $ 359 $ 403 $ - $ 762
State and local government 2,391 117 (22) 2,486
Foreign government 882 70 (8) 944
Corporate 7,197 167 (529) 6,835
Federal agency mortgage-backed (1) 36 1 - 37
Other mortgage-backed 149 - (25) 124
Other asset-backed 455 128 (13) 570
Total $ 11,469 $ 886 $ (597) $ 11,758
(1) Federal agency mortgage-backed securities were first purchased in 2008 as part of the acquired business.