Cigna 2009 Annual Report Download - page 77
Download and view the complete annual report
Please find page 77 of the 2009 Cigna annual report below. You can navigate through the pages in the report by either clicking on the pages listed below, or by using the keyword search tool below to find specific information within the annual report.-
 1
1 -
2
-
3
-
4
-
5
-
6
-
7
-
8
-
9
-
10
-
11
-
12
-
13
-
14
-
15
-
16
-
17
-
18
-
19
-
20
-
21
-
22
-
23
-
24
-
25
-
26
-
27
-
28
-
29
-
30
-
31
-
32
-
33
-
34
-
35
-
36
-
37
-
38
-
39
-
40
-
41
-
42
-
43
-
44
-
45
-
46
-
47
-
48
-
49
-
50
-
51
-
52
-
53
-
54
-
55
-
56
-
57
-
58
-
59
-
60
-
61
-
62
-
63
-
64
-
65
-
66
-
 67
67 -
 68
68 -
 69
69 -
 70
70 -
 71
71 -
 72
72 -
 73
73 -
 74
74 -
 75
75 -
 76
76 -
 77
77 -
 78
78 -
 79
79 -
 80
80 -
 81
81 -
 82
82 -
 83
83 -
 84
84 -
 85
85 -
 86
86 -
 87
87 -
88
-
89
-
90
-
91
-
92
-
93
-
94
-
95
-
96
-
97
-
98
-
99
-
100
-
101
-
102
-
103
-
104
-
105
-
106
-
107
-
108
-
109
-
110
-
111
-
112
-
113
-
114
-
115
-
116
-
117
-
118
-
119
-
120
-
121
-
122
-
123
-
124
-
125
-
126
-
127
-
128
-
129
-
130
-
131
-
132
-
133
-
134
-
135
-
136
-
137
-
138
-
139
-
140
-
141
-
142
-
143
-
144
-
145
-
146
-
147
-
148
-
149
-
150
-
151
-
152
-
153
-
154
-
155
-
156
-
157
-
158
-
159
-
160
-
161
-
162
-
163
-
164
-
165
-
166
-
167
-
168
-
169
-
170
-
171
-
172
-
173
-
174
-
175
-
176
-
177
-
178
-
179
-
180
-
181
-
182
-
183
-
184
-
185
-
186
-
187
-
188
-
189
-
190
-
191
-
192
-
193
-
194
-
195
-
196
-
197
-
198
-
199
-
200
-
201
-
202
-
203
-
204
-
205
-
206
-
207
-
208
-
209
-
210
-
211
-
212
-
213
-
214
-
215
-
216
-
217
-
218
-
219
-
220
-
221
-
222
-
223
-
224
-
225
-
226
-
227
-
228
 |
 |

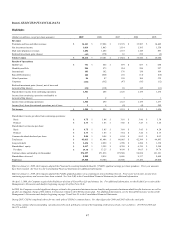
57
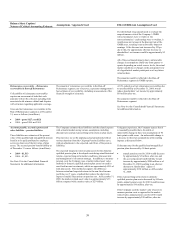
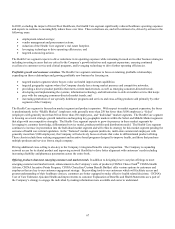
Balance Sheet Caption /
Nature of Critical Accounting Estimate Assumptions / Approach Used Effect if Different Assumptions Used
The difference between this estimate of the ultimate liability and
the current paid claims data is the estimate of the remaining
claims to be paid for each incurral month. These monthly
estimates are aggregated and included in the Company's Health
Care medical claims payable at the end of each reporting period.
Completion factors are used to estimate the health care medical
claims payable for all months where claims have not been
completely resolved and paid, except for the most recent month
as described below.
Completion factors are impacted by several key items including
changes in the level of claims processed electronically versus
manually (auto-adjudication), changes in provider claims
submission rates, membership changes and the mix of products.
As noted, the Company uses historical completion factors
combined with an analysis of current trends and operational
factors to develop current estimates of completion factors. This
approach implicitly assumes that historical completion rates will
be a useful indicator for the current period. It is possible that
the actual completion rates for the current period will develop
differently from historical patterns, which could have a material
impact on the Company's medical claims payable and net
income.
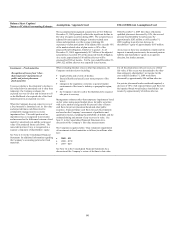
Claims incurred in the most recent month have limited paid
claims data, since a large portion of health care claims are not
submitted to the Company for payment in the month services
have been provided. This makes the completion factor approach
less reliable for claims incurred in the most recent month. As a
result, in any reporting period, for the estimates of the ultimate
claims incurred in the most recent month, the Company
primarily relies on medical cost trend analysis, which reflects
expected claim payment patterns and other relevant operational
considerations. Medical cost trend is impacted by several key
factors including medical service utilization and unit costs and
the Company’s ability to manage these factors through benefit
design, underwriting, provider contracting and the Company's
medical management initiatives. These factors are affected by
changes in the level and mix of medical benefits offered,
including inpatient, outpatient and pharmacy, the impact of
copays and deductibles, changes in provider practices and
changes in consumer demographics and consumption behavior.
Because historical trend factors are often not representative of
current claim trends, the trend experienced for the most recent
history along with an analysis of emerging trends, have been
taken into consideration in establishing the liability for medical
claims payable at December 31, 2009 and 2008. It is possible
that the actual medical trend for the current period will develop
differently from the expected, which could have a material
impact on the Company's medical claims payable and net
income.
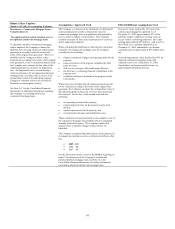
For each reporting period, the Company evaluates key
assumptions by comparing the assumptions used in establishing
the medical claims payable to actual experience. When actual
experience differs from the assumptions used in establishing the
liability, medical claims payable are increased or decreased
through current period net income. Additionally, the Company
evaluates expected future developments and emerging trends
which may impact key assumptions. The estimation process
involves considerable judgment, reflecting the variability
inherent in forecasting future claim payments. The adequacy of
these estimates is highly sensitive to changes in the Company's
key assumptions, specifically completion factors, which are
impacted by actual or expected changes in the submission and
payment of medical claims, and medical cost trends, which are
impacted by actual or expected changes in the utilization of
medical services and unit costs.