BMW 2006 Annual Report Download - page 87
Download and view the complete annual report
Please find page 87 of the 2006 BMW annual report below. You can navigate through the pages in the report by either clicking on the pages listed below, or by using the keyword search tool below to find specific information within the annual report.-
 1
1 -
2
-
3
-
4
-
5
-
6
-
7
-
8
-
9
-
10
-
11
-
12
-
13
-
14
-
15
-
16
-
17
-
18
-
19
-
20
-
21
-
22
-
23
-
24
-
25
-
26
-
27
-
28
-
29
-
30
-
31
-
32
-
33
-
34
-
35
-
36
-
37
-
38
-
39
-
40
-
41
-
42
-
43
-
44
-
45
-
46
-
47
-
48
-
49
-
50
-
51
-
52
-
53
-
54
-
55
-
56
-
57
-
58
-
59
-
60
-
61
-
62
-
63
-
64
-
65
-
66
-
67
-
68
-
69
-
70
-
71
-
72
-
73
-
74
-
75
-
76
-
 77
77 -
 78
78 -
 79
79 -
 80
80 -
 81
81 -
 82
82 -
 83
83 -
 84
84 -
 85
85 -
 86
86 -
 87
87 -
 88
88 -
 89
89 -
 90
90 -
 91
91 -
 92
92 -
 93
93 -
 94
94 -
 95
95 -
 96
96 -
 97
97 -
98
-
99
-
100
-
101
-
102
-
103
-
104
-
105
-
106
-
107
-
108
-
109
-
110
-
111
-
112
-
113
-
114
-
115
-
116
-
117
-
118
-
119
-
120
-
121
-
122
-
123
-
124
-
125
-
126
-
127
-
128
-
129
-
130
-
131
-
132
-
133
-
134
-
135
-
136
-
137
-
138
-
139
-
140
-
141
-
142
-
143
-
144
-
145
-
146
-
147
-
148
-
149
-
150
-
151
-
152
-
153
-
154
-
155
-
156
-
157
-
158
-
159
-
160
-
161
-
162
-
163
-
164
-
165
-
166
-
167
-
168
-
169
-
170
-
171
-
172
-
173
-
174
-
175
-
176
-
177
-
178
-
179
-
180
-
181
-
182
-
183
-
184
-
185
-
186
-
187
-
188
-
189
-
190
-
191
-
192
-
193
-
194
-
195
-
196
-
197
 |
 |

86 Group Financial Statements
65 Group Financial Statements
65 Income Statements
66 Balance Sheets
68 Cash Flow Statements
70 Group Statement of
Changes in Equity
71 Statement of Income and
Expenses recognised directly
in Equity
72 Notes
72 – Accounting Principles
and Policies
79 – Notes to the Income Statement
86 – Notes to the Balance Sheet
104 – Other Disclosures
111 – Segment Information
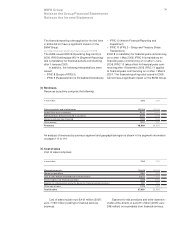
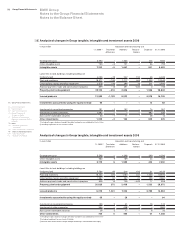
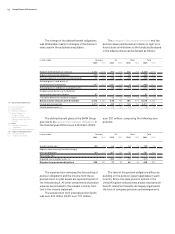
in euro million Acquisition and manufacturing cost
1.1.20061]Translation Additions Reclassi- Disposals 31.12.2006
differences fications
1]including the gross balances brought forward of companies consolidated for the first time
2]including impairment losses of euro 15 million
Analysis of changes in Group tangible, intangible and investment assets 2006
[18]
BMW Group
Notes to the Group Financial Statements
Notes to the Balance Sheet
Development costs 6,593 – 1,536 – 445 7,684
Other intangible assets 739 –5 121 – 56 799
Intangible assets 7,332 –5 1,657 – 501 8,483
Land, titles to land, buildings, including buildings on
third party land 6,150 –70 242 152 49 6,425
Plant and machinery 18,977 –185 1,717 464 1,333 19,640
Other facilities, factory and office equipment 2,078 –46 206 16 211 2,043
Advance payments made and construction in progress 899 –15 491 –632 3 740
Property, plant and equipment 28,104 –316 2,656 – 1,596 28,848
Leased products 13,983 –1,182 8,522 – 4,578 16,745
Investments accounted for using the equity method 94–––1282
Investments in associated companies 191 –2 152 – 74 267
Investments in other companies 1,002–––807195
Non-current marketable securities 32 –1 11 – 28 14
Other investments 1,225 –3 163 – 909 476
in euro million Acquisition and manufacturing cost
1.1.20051]Translation Additions Reclassi- Disposals 31.12.2005
differences fications
1]including the gross balances brought forward of companies consolidated for the first time
2]including impairment losses of euro 25 million
3]total fair value measurement changes recognised directly in accumulated other equity
Analysis of changes in Group tangible, intangible and investment assets 2005
Development costs 5,596 – 1,396 – 399 6,593
Other intangible assets 583 9 189 – 44 737
Intangible assets 6,179 9 1,585 – 443 7,330
Land, titles to land, buildings, including buildings on
third party land 5,584 89 314 183 31 6,139
Plant and machinery 18,464 222 1,107 441 1,260 18,974
Other facilities, factory and office equipment 1,957 51 257 21 225 2,061
Advance payments made and construction in progress 820 10 730 –645 17 898
Property, plant and equipment 26,825 372 2,408 – 1,533 28,072
Leased products 9,275 1,291 7,202 – 3,785 13,983
Investments accounted for using the equity method 65 – 29 – – 94
Investments in associated companies 150 2 41 – 19 174
Investments in other companies 564 – 4383] – – 1,002
Non-current marketable securities 20 3 17 – 8 32
Other investments 734 5 496 – 27 1,208