BMW 2006 Annual Report Download - page 49
Download and view the complete annual report
Please find page 49 of the 2006 BMW annual report below. You can navigate through the pages in the report by either clicking on the pages listed below, or by using the keyword search tool below to find specific information within the annual report.-
 1
1 -
2
-
3
-
4
-
5
-
6
-
7
-
8
-
9
-
10
-
11
-
12
-
13
-
14
-
15
-
16
-
17
-
18
-
19
-
20
-
21
-
22
-
23
-
24
-
25
-
26
-
27
-
28
-
29
-
30
-
31
-
32
-
33
-
34
-
35
-
36
-
37
-
38
-
 39
39 -
 40
40 -
 41
41 -
 42
42 -
 43
43 -
 44
44 -
 45
45 -
 46
46 -
 47
47 -
 48
48 -
 49
49 -
 50
50 -
 51
51 -
 52
52 -
 53
53 -
 54
54 -
 55
55 -
 56
56 -
 57
57 -
 58
58 -
 59
59 -
60
-
61
-
62
-
63
-
64
-
65
-
66
-
67
-
68
-
69
-
70
-
71
-
72
-
73
-
74
-
75
-
76
-
77
-
78
-
79
-
80
-
81
-
82
-
83
-
84
-
85
-
86
-
87
-
88
-
89
-
90
-
91
-
92
-
93
-
94
-
95
-
96
-
97
-
98
-
99
-
100
-
101
-
102
-
103
-
104
-
105
-
106
-
107
-
108
-
109
-
110
-
111
-
112
-
113
-
114
-
115
-
116
-
117
-
118
-
119
-
120
-
121
-
122
-
123
-
124
-
125
-
126
-
127
-
128
-
129
-
130
-
131
-
132
-
133
-
134
-
135
-
136
-
137
-
138
-
139
-
140
-
141
-
142
-
143
-
144
-
145
-
146
-
147
-
148
-
149
-
150
-
151
-
152
-
153
-
154
-
155
-
156
-
157
-
158
-
159
-
160
-
161
-
162
-
163
-
164
-
165
-
166
-
167
-
168
-
169
-
170
-
171
-
172
-
173
-
174
-
175
-
176
-
177
-
178
-
179
-
180
-
181
-
182
-
183
-
184
-
185
-
186
-
187
-
188
-
189
-
190
-
191
-
192
-
193
-
194
-
195
-
196
-
197
 |
 |
48 Group Management Report
10 Group Management Report
10 A Review of the Financial Year
12
General EconomicEnvironment
15 Review of operations
38 BMW Stock and Bonds
41 Disclosures pursuant to §289 (4)
and §315 (4) HGB
43 Financial Analysis
43 – Internal Management System
44 – Earnings performance
46 – Financial position
48 – Net assets position
50 – Subsequent events report
50 – Value added statement
53 – Key performance figures
54 – Comments on BMW AG
58 Risk Management
62 Outlook
equivalents of euro 285 million (2005: decrease of
euro 507 million).
Net interest-bearing assets relating to Industrial
operations (including receivables from the financial
operations sub-group) amounted to euro 5,385 mil-
lion at 31 December 2006, an increase of euro 508
million compared to one year earlier. Net interest-
bearing assets relating to Industrial operations com-
prise cash and cash equivalents (euro 1,235 million),
marketable securities relating to Industrial operations
(euro1,993 million) and receivables from Financial
operations (euro 4,276 million) less financial liabili-
ties relating to Industrial operations. Excluding inter-
est and currency derivatives, the latter amounted to
euro 2,119 million.
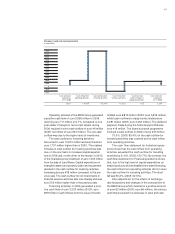
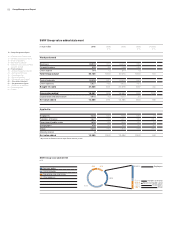
Net assets position
The group balance sheet total increased by euro
4,491 million or 6.0% to euro 79,057 million. Cur-
rency effects, largely attributable to a weaker US
dollar, held down the increase in the balance sheet
total in 2006. Adjusted for changes in exchange
rates, the balance sheet total would have increased
by10.0% or euro 7,162 million. The main factors
behind the increase on the assets side were the in-
creased level of leased products (+19.9%), financial
assets (+19.8%), intangible assets (+15.7%) and
receivables from sales financing (+4.5 %). On the
equity and liabilities side of the balance sheet, the
main increases related to equity (+12.7%) and finan-
cial liabilities (+5.2%).
Intangible assets increased by15.7% to euro
5,312 million. Within intangible assets, capitalised
development costs went up by 16.0% to euro
4,810 million. Development costs recognised as as-
sets during the year under report amounted to euro
1,536 million (+10.0%), equivalent to a capitalisa-
tion ratio of 47.9 % (2005: 44.8%). As in the previous
year, increased capitalised development costs re-
sulted from the higher number of projects in the
series development phase. Amortisation on intangi-
ble assets totalled euro 872 million (+17.0 %).
The carrying amount of property, plant and
equipment increased by1.8 % to euro 11,285 mil-
lion. The bulk of capital expenditure related to further
expansion of the worldwide production and sales
networks. Capital expenditure on property, plant and
equipment was euro 2,656 million,10.3% more
than in the previous year. Important areas of capital
expenditure included expansion of the Oxford and
Spartanburg plants. Depreciation on property, plant
and equipment totalled euro 2,313 million (+4.6%).
Balances brought forward for subsidiaries being
consolidated for the first time amounted to euro
22 million. Capital expenditure on intangible assets
and property, plant and equipment totalled euro
4,313 million (+8.0 %), which, as in the previous
year,
was financed fully out of cash flow. Capital
expenditure as a percentage of revenues was 8.8%
(2005: 8.6%).
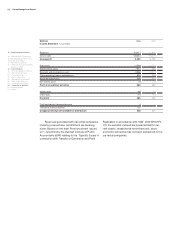
As a result of the growth of business, the total
carrying amount of leased products increased
sharply by19.9% to euro 13,642 million. Adjusted
for changes in exchange rates, leased products
would have risen by 29.9%.
The carrying amount of other investments de-
creased by 66.0 % to euro 401 million, mainly as a
result of the partial settlement of the exchangeable
bond on shares in Rolls-Royce plc, London.The
market value of the remaining investment is now
euro 99 million above its historical cost. Fair value
gains or losses on the shares are recognised directly
in other accumulated equity.
Receivables from sales financing were up by
4.5% to euro 30,368 million due to the higher
business volume. Of this amount, customer and
dealer financing accounted for euro 23,038 million
(+3.3%) and finance leases accounted for euro
7,330 million (+8.6%).
Inventories increased by euro 267 million
(+4.1%) to euro 6,794 million, mainly as a result of
the inclusion of new sales companies in the group
reporting entity. Trade receivables went up by 5.8%
compared to 31 December 2005.