BMW 2006 Annual Report Download - page 12
Download and view the complete annual report
Please find page 12 of the 2006 BMW annual report below. You can navigate through the pages in the report by either clicking on the pages listed below, or by using the keyword search tool below to find specific information within the annual report.-
 1
1 -
 2
2 -
 3
3 -
 4
4 -
 5
5 -
 6
6 -
 7
7 -
 8
8 -
 9
9 -
 10
10 -
 11
11 -
 12
12 -
 13
13 -
 14
14 -
 15
15 -
 16
16 -
 17
17 -
 18
18 -
 19
19 -
 20
20 -
 21
21 -
 22
22 -
23
-
24
-
25
-
26
-
27
-
28
-
29
-
30
-
31
-
32
-
33
-
34
-
35
-
36
-
37
-
38
-
39
-
40
-
41
-
42
-
43
-
44
-
45
-
46
-
47
-
48
-
49
-
50
-
51
-
52
-
53
-
54
-
55
-
56
-
57
-
58
-
59
-
60
-
61
-
62
-
63
-
64
-
65
-
66
-
67
-
68
-
69
-
70
-
71
-
72
-
73
-
74
-
75
-
76
-
77
-
78
-
79
-
80
-
81
-
82
-
83
-
84
-
85
-
86
-
87
-
88
-
89
-
90
-
91
-
92
-
93
-
94
-
95
-
96
-
97
-
98
-
99
-
100
-
101
-
102
-
103
-
104
-
105
-
106
-
107
-
108
-
109
-
110
-
111
-
112
-
113
-
114
-
115
-
116
-
117
-
118
-
119
-
120
-
121
-
122
-
123
-
124
-
125
-
126
-
127
-
128
-
129
-
130
-
131
-
132
-
133
-
134
-
135
-
136
-
137
-
138
-
139
-
140
-
141
-
142
-
143
-
144
-
145
-
146
-
147
-
148
-
149
-
150
-
151
-
152
-
153
-
154
-
155
-
156
-
157
-
158
-
159
-
160
-
161
-
162
-
163
-
164
-
165
-
166
-
167
-
168
-
169
-
170
-
171
-
172
-
173
-
174
-
175
-
176
-
177
-
178
-
179
-
180
-
181
-
182
-
183
-
184
-
185
-
186
-
187
-
188
-
189
-
190
-
191
-
192
-
193
-
194
-
195
-
196
-
197
 |
 |
11
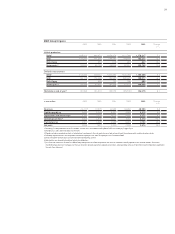
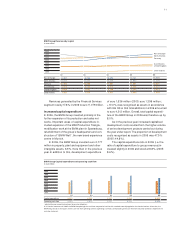
of euro 1,536 million (2005: euro 1,396 million;
+10.0%) was recognised as assets in accordance
with IAS 38 so that total additions in 2006 amounted
to euro 4,313 million. Overall, total capital expendi-
ture of the BMW Group in 2006 was therefore up by
8.0%.
As in the previous year, increased capitalised
development costs resulted from the higher volume
of series development projects carried out during
the year under report.The proportion of development
costs recognised as assets in 2006 was 47.9%
(2005: 44.8 %).
The capital expenditure ratio in 2006 (i.e. the
ratio of capital expenditure to group revenues) in-
creased slightly in 2006 and stood at 8.8% (2005:
8.6%).
Revenues generated by the Financial Services
segment rose by17.8% in2006 to euro11,079 million.
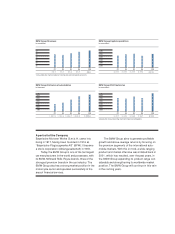
Increased capital expenditure
In 2006, the BMW Group invested primarily in the
further expansion of its production and sales net-
works. Important areas of capital expenditure in-
cluded expansion of the MINI Production Triangle,
modification work at the BMW plant in Spartanburg,
refurbishment of the group’s headquarters and con-
struction
of “BMW Welt”, the new brand experience
centre in Munich.
In 2006, the BMW Group invested euro 2,777
million in property, plant and equipment and other
intangible assets, 6.9% more than in the previous
year. In addition to this, development expenditure
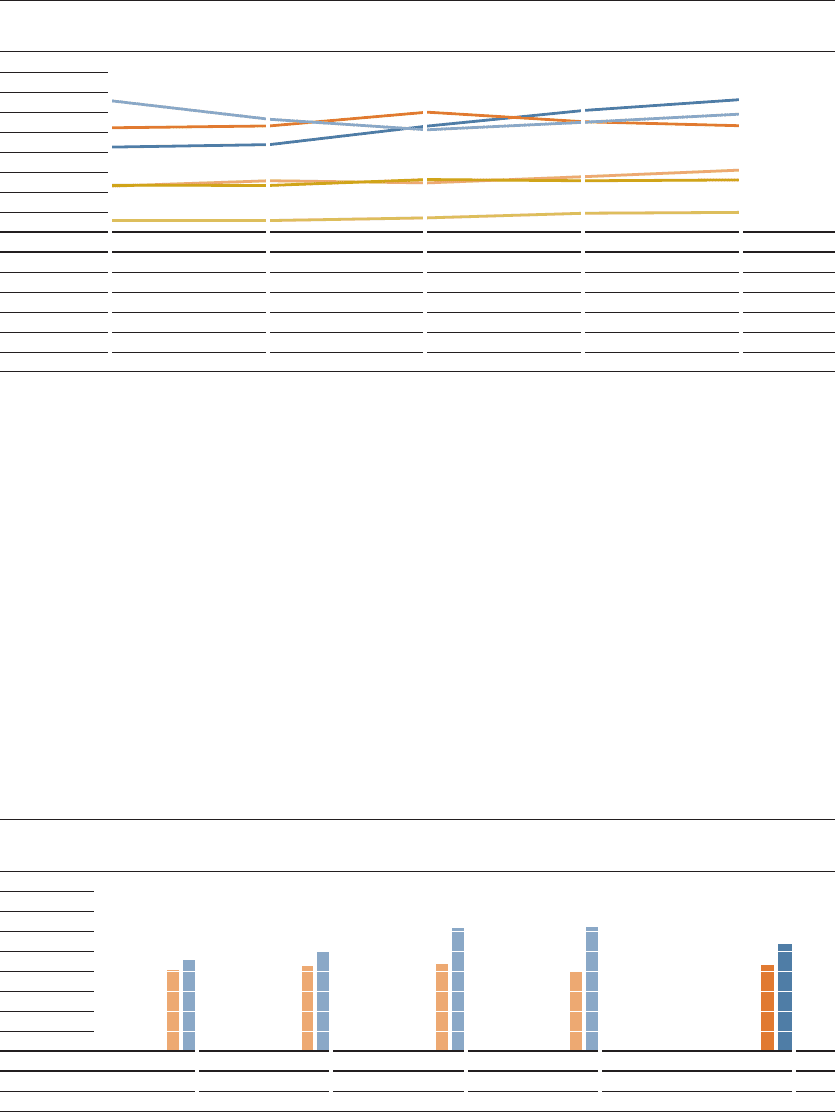
BMW Group Capital expenditure and operating cash flow
in euro million
8,000
7,000
6,000
5,000
4,000
3,000
2,000
1,000
*adjusted for new accounting treatment of pension obligations
02
4,042
4,553
Capital expenditure
Operating cash flow
03
4,245
4,970
04
4,347
6,157*
05
3,993
6,184
06
4,313
5,373
In its financial statements for 2005, the BMW Group brought the cash flow computation into line with standards normally applied on the financial markets. Since then, the
BMW Group discloses the figures for the cash flow from operating activities (operating cash flow), corresponding to the cash flow from Industrial Operations reported in the
cash flow statement.
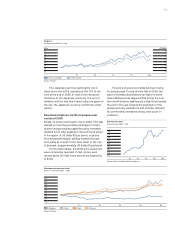
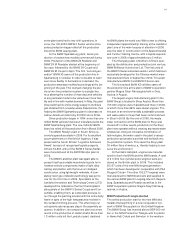
Rest of Europe
North America
Germany
Asia/Oceania
United Kingdom
Other markets
BMW Group Revenues by region
in euro million
16,000
14,000
12,000
10,000
8,000
6,000
4,000
2,000
8,481
13,085
10,404
4,594
4,687
1,160
02 03
8,728
11,252
10,590
5,130
4,661
1,164
04
10,574
10,205
11,961
4,915
5,249
1,431
12,141
10,957
11,001
5,538
5,125
1,894
05 06
13,226
11,779
10,601
6,200
5,214
1,979
Rest of Europe
North America
Germany
Asia/Oceania
United Kingdom
Other markets