BMW 2006 Annual Report Download - page 106
Download and view the complete annual report
Please find page 106 of the 2006 BMW annual report below. You can navigate through the pages in the report by either clicking on the pages listed below, or by using the keyword search tool below to find specific information within the annual report.-
 1
1 -
2
-
3
-
4
-
5
-
6
-
7
-
8
-
9
-
10
-
11
-
12
-
13
-
14
-
15
-
16
-
17
-
18
-
19
-
20
-
21
-
22
-
23
-
24
-
25
-
26
-
27
-
28
-
29
-
30
-
31
-
32
-
33
-
34
-
35
-
36
-
37
-
38
-
39
-
40
-
41
-
42
-
43
-
44
-
45
-
46
-
47
-
48
-
49
-
50
-
51
-
52
-
53
-
54
-
55
-
56
-
57
-
58
-
59
-
60
-
61
-
62
-
63
-
64
-
65
-
66
-
67
-
68
-
69
-
70
-
71
-
72
-
73
-
74
-
75
-
76
-
77
-
78
-
79
-
80
-
81
-
82
-
83
-
84
-
85
-
86
-
87
-
88
-
89
-
90
-
91
-
92
-
93
-
94
-
95
-
 96
96 -
 97
97 -
 98
98 -
 99
99 -
 100
100 -
 101
101 -
 102
102 -
 103
103 -
 104
104 -
 105
105 -
 106
106 -
 107
107 -
 108
108 -
 109
109 -
 110
110 -
 111
111 -
 112
112 -
 113
113 -
 114
114 -
 115
115 -
 116
116 -
117
-
118
-
119
-
120
-
121
-
122
-
123
-
124
-
125
-
126
-
127
-
128
-
129
-
130
-
131
-
132
-
133
-
134
-
135
-
136
-
137
-
138
-
139
-
140
-
141
-
142
-
143
-
144
-
145
-
146
-
147
-
148
-
149
-
150
-
151
-
152
-
153
-
154
-
155
-
156
-
157
-
158
-
159
-
160
-
161
-
162
-
163
-
164
-
165
-
166
-
167
-
168
-
169
-
170
-
171
-
172
-
173
-
174
-
175
-
176
-
177
-
178
-
179
-
180
-
181
-
182
-
183
-
184
-
185
-
186
-
187
-
188
-
189
-
190
-
191
-
192
-
193
-
194
-
195
-
196
-
197
 |
 |

105
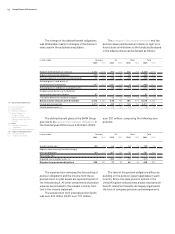
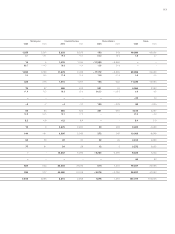
The fair values shown are computed using mar-
ket information available at the balance sheet date,
on the basis of prices quoted by the contract partners
or using appropriate measurement methods, e.g.
discounted cash flow models. In the latter case,
amounts were discounted at 31 December 2006 on
the basis of the following interest rates:
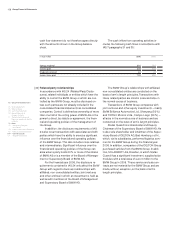
Financial instruments
Use and control of financial instruments
As an enterprise with worldwide operations, busi-
ness is conducted in a variety of currencies, from
which exchange rate risks arise. The BMW Group’s
operations are financed in various currencies,
mainly by the issue of bonds and medium term
notes and through bank loans. The BMW Group’s
financial management system involves the use of
standard financial instruments such as short-term
deposits, investments in variable and fixed-income
securities as well as securities funds. The BMW
Group is therefore exposed to risks resulting from
changes in interest rates, market prices and ex-
change rates. Financial instruments are only used
to hedge underlying positions or forecast trans-
actions.
Protection against such risks is provided at first
instance though natural hedging which arises when
the values of non-derivative financial instruments
have matching maturities and amounts (netting).
These future obligations are matched, or ex-
ceeded, by income on sub-leases.
Purchase commitments for property, plant and
equipment amount to euro 1,099 million (2005: euro
1,057 million).
Sundry other financial commitments amount to
euro 249 million (2005: euro 217 million).
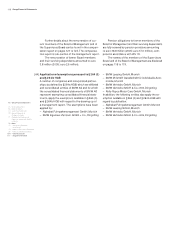
Derivative financial instruments are used to reduce
the risk remaining after netting.
The scope of permitted transactions, responsi-
bilities, financial reporting procedures and control
mechanisms used for financial instruments are set
out in internal guidelines. This includes, above all, a
clear separation of duties between trading and pro-
cessing. Exchange rate, interest rate and liquidity
risks of the BMW Group are managed at a corporate
level. At 31 December 2006, derivative financial in-
struments were in place to hedge exchange rate
risks, in particular for the currencies US dollar, British
pound, Canadian dollar and Japanese yen.
Further disclosures relating to risk management
are provided in the management report.
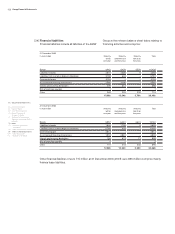
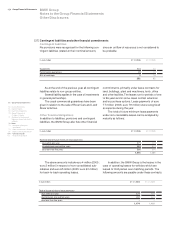
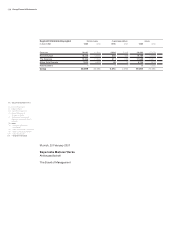
Quantitative disclosures on financial
instruments
The carrying amount and fair value of material non-
derivative financial instruments are set out in the
following table:
[38]
in euro million 31.12.2006 31.12.2005
Carrying amount Fair value Carrying amount Fair value
Receivables from sales financing 30,368 30,183 29,053 29,426
Financial liabilities 36,456 36,244 34,668 34,534
ISO-Code EUR USD GBP JPY
in %
Interest rate for six months 3.8 5.4 5.4 0.6
Interest rate for one year 4.0 5.3 5.6 0.8
Interest rate for five years 4.1 5.1 5.4 1.4
Interest rate for ten years 4.2 5.2 5.1 1.9