BMW 2006 Annual Report Download - page 70
Download and view the complete annual report
Please find page 70 of the 2006 BMW annual report below. You can navigate through the pages in the report by either clicking on the pages listed below, or by using the keyword search tool below to find specific information within the annual report.-
 1
1 -
2
-
3
-
4
-
5
-
6
-
7
-
8
-
9
-
10
-
11
-
12
-
13
-
14
-
15
-
16
-
17
-
18
-
19
-
20
-
21
-
22
-
23
-
24
-
25
-
26
-
27
-
28
-
29
-
30
-
31
-
32
-
33
-
34
-
35
-
36
-
37
-
38
-
39
-
40
-
41
-
42
-
43
-
44
-
45
-
46
-
47
-
48
-
49
-
50
-
51
-
52
-
53
-
54
-
55
-
56
-
57
-
58
-
59
-
 60
60 -
 61
61 -
 62
62 -
 63
63 -
 64
64 -
 65
65 -
 66
66 -
 67
67 -
 68
68 -
 69
69 -
 70
70 -
 71
71 -
 72
72 -
 73
73 -
 74
74 -
 75
75 -
 76
76 -
 77
77 -
 78
78 -
 79
79 -
 80
80 -
81
-
82
-
83
-
84
-
85
-
86
-
87
-
88
-
89
-
90
-
91
-
92
-
93
-
94
-
95
-
96
-
97
-
98
-
99
-
100
-
101
-
102
-
103
-
104
-
105
-
106
-
107
-
108
-
109
-
110
-
111
-
112
-
113
-
114
-
115
-
116
-
117
-
118
-
119
-
120
-
121
-
122
-
123
-
124
-
125
-
126
-
127
-
128
-
129
-
130
-
131
-
132
-
133
-
134
-
135
-
136
-
137
-
138
-
139
-
140
-
141
-
142
-
143
-
144
-
145
-
146
-
147
-
148
-
149
-
150
-
151
-
152
-
153
-
154
-
155
-
156
-
157
-
158
-
159
-
160
-
161
-
162
-
163
-
164
-
165
-
166
-
167
-
168
-
169
-
170
-
171
-
172
-
173
-
174
-
175
-
176
-
177
-
178
-
179
-
180
-
181
-
182
-
183
-
184
-
185
-
186
-
187
-
188
-
189
-
190
-
191
-
192
-
193
-
194
-
195
-
196
-
197
 |
 |
69
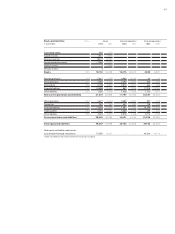
Industrial operations*Financial operations*
2006 2005 2006 2005
2,449 1,954 535 527 Net profit
453,560 2,899 Depreciation of leased products
3,315 2,997 25 28 Depreciation and amortisation of tangible, intangible and investment assets
236 441 –104 304 Change in provisions
77 –54 227 418 Change in deferred taxes
–436 342 107 –166 Other non-cash income and expense items
–70 –99 2–Gain/loss on disposal of non-current assets and marketable securities
25 –14 – –Result from equity accounted investments
Changes in current assets and liabilities
–261 184 –4 3Change in inventories
–330 –73 –70 218 Change in receivables
364 501 329 276 Increase in liabilities
5,373 6,184 4,607 4,507 Cash inflow from operating activities
–4,272 –3,834 –41 –41 Investment in intangible assets and property, plant and equipment
31 39 83Proceeds from the disposal of intangible assets and property, plant and equipment
–24 138 –5 –212 Expenditure for investments
76 634 7Proceeds from the disposal of investments
– 1,000 – –Proceeds from sale of Land Rover
–392 –369 –10,362 –9,092 Investment in leased products
364 355 3,355 2,842 Disposals of leased products
– ––50,313 –45,365 Additions to receivables from sales financing
– –47,848 42,634 Payments received on receivables from sales financing
–2,619 –183 –35 –272 Investment in marketable securities
2,419 381 258 –Proceeds from marketable securities
–4,417 –2,467 –9,253 –9,496 Cash outflow from investing activities
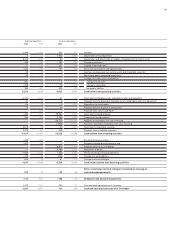
–253 –506 – –Buy-back of treasury shares
–419 –419 – –Payment of dividend for the previous year
1–6,875 5,819 Proceeds from the issue of bonds
–1 ––4,490 –3,432 Repayment of bonds
–1,040 –3,456 1,040 3,456 Internal financing of financial operations
–129 –108 1,156 –106 Change in financial liabilities
644 129 –61 –678 Change in commercial paper
–1,197 –4,360 4,520 5,059 Cash inflow/outflow from financing activities
Effect of exchange rate and changes in composition of group on
104 18 –22 48 cash and cash equivalents
–137 –625 –148 118 Change in cash and cash equivalents
1,372 1,997 249 131 Cash and cash equivalents as at 1January
1,235 1,372 101 249 Cash and cash equivalents as at 31 December