BMW 2006 Annual Report Download - page 81
Download and view the complete annual report
Please find page 81 of the 2006 BMW annual report below. You can navigate through the pages in the report by either clicking on the pages listed below, or by using the keyword search tool below to find specific information within the annual report.-
 1
1 -
2
-
3
-
4
-
5
-
6
-
7
-
8
-
9
-
10
-
11
-
12
-
13
-
14
-
15
-
16
-
17
-
18
-
19
-
20
-
21
-
22
-
23
-
24
-
25
-
26
-
27
-
28
-
29
-
30
-
31
-
32
-
33
-
34
-
35
-
36
-
37
-
38
-
39
-
40
-
41
-
42
-
43
-
44
-
45
-
46
-
47
-
48
-
49
-
50
-
51
-
52
-
53
-
54
-
55
-
56
-
57
-
58
-
59
-
60
-
61
-
62
-
63
-
64
-
65
-
66
-
67
-
68
-
69
-
70
-
 71
71 -
 72
72 -
 73
73 -
 74
74 -
 75
75 -
 76
76 -
 77
77 -
 78
78 -
 79
79 -
 80
80 -
 81
81 -
 82
82 -
 83
83 -
 84
84 -
 85
85 -
 86
86 -
 87
87 -
 88
88 -
 89
89 -
 90
90 -
 91
91 -
92
-
93
-
94
-
95
-
96
-
97
-
98
-
99
-
100
-
101
-
102
-
103
-
104
-
105
-
106
-
107
-
108
-
109
-
110
-
111
-
112
-
113
-
114
-
115
-
116
-
117
-
118
-
119
-
120
-
121
-
122
-
123
-
124
-
125
-
126
-
127
-
128
-
129
-
130
-
131
-
132
-
133
-
134
-
135
-
136
-
137
-
138
-
139
-
140
-
141
-
142
-
143
-
144
-
145
-
146
-
147
-
148
-
149
-
150
-
151
-
152
-
153
-
154
-
155
-
156
-
157
-
158
-
159
-
160
-
161
-
162
-
163
-
164
-
165
-
166
-
167
-
168
-
169
-
170
-
171
-
172
-
173
-
174
-
175
-
176
-
177
-
178
-
179
-
180
-
181
-
182
-
183
-
184
-
185
-
186
-
187
-
188
-
189
-
190
-
191
-
192
-
193
-
194
-
195
-
196
-
197
 |
 |

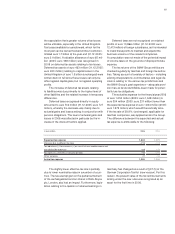
Manufacturing costs for industrial operations
include impairment losses on intangible assets and
property, plant and equipment of euro 15 million
(2005: euro 25 million). Public subsidies in the form
of reduced taxes on assets and consumption-based
taxes amounted to euro 11 million (2005: euro 15
million).
Sales and administrative costs
Sales costs amounted to euro 4,039 million (2005:
euro 3,889 million) and comprise mainly marketing,
advertising and sales personnel costs.
Administrative costs amounted to euro 933
mil-
lion (2005:euro 873 million) and comprised expenses
for administration not attributable to development,
production or sales functions.
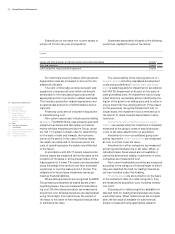
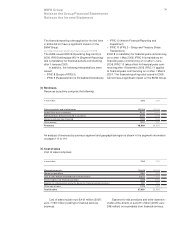
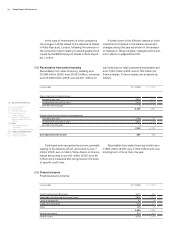
Research and development costs
Research and development costs of euro 2,544 mil-
lion (2005: euro 2,464 million) comprise all research
costs and development costs not recognised as
assets as well as amortisation and disposals of capi-
talised development costs totalling euro 872 million
(2005: euro 745 million).
Total research and development expenditure
comprising research costs, development costs not
recognised as assets and capitalised development
costs were as follows:
80 Group Financial Statements
65 Group Financial Statements
65 Income Statements
66 Balance Sheets
68 Cash Flow Statements
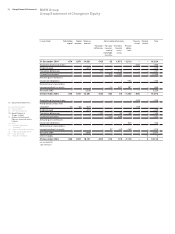
70 Group Statement of
Changes in Equity
71 Statement of Income and
Expenses recognised directly
in Equity
72 Notes
72 – Accounting Principles
and Policies
79 – Notes to the Income Statement
86 – Notes to the Balance Sheet
104 – Other Disclosures
111 – Segment Information
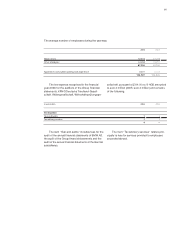
in euro million 2006 2005
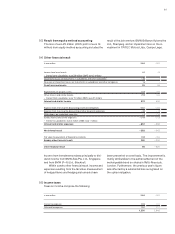
Other operating income and expenses
Sundry operating income includes public-sector grants of euro 32 million (2005: euro 36 million).
in euro million 2006 2005
Research and development costs 2,544 2,464
Amortisation –872 –745
New expenditure for capitalised development costs 1,536 1,396
Total research and development expenditures 3,208 3,115
Exchange gains 245 135
Income from the reversal of provisions 141 265
Income from the reversal of write-downs 24 66
Gains on the disposal of assets 102 116
Sundry operating income 232 262
Other operating income 744 844
Exchange losses 219 161
Expense for additions to provisions 109 165
Expenses for write-downs on receivables 34 29
Sundry operating expenses 155 134
Other operating expenses 517 489
Other operating income and expenses 227 355
[10]
[11]
[12]