BMW 2006 Annual Report Download - page 45
Download and view the complete annual report
Please find page 45 of the 2006 BMW annual report below. You can navigate through the pages in the report by either clicking on the pages listed below, or by using the keyword search tool below to find specific information within the annual report.-
 1
1 -
2
-
3
-
4
-
5
-
6
-
7
-
8
-
9
-
10
-
11
-
12
-
13
-
14
-
15
-
16
-
17
-
18
-
19
-
20
-
21
-
22
-
23
-
24
-
25
-
26
-
27
-
28
-
29
-
30
-
31
-
32
-
33
-
34
-
 35
35 -
 36
36 -
 37
37 -
 38
38 -
 39
39 -
 40
40 -
 41
41 -
 42
42 -
 43
43 -
 44
44 -
 45
45 -
 46
46 -
 47
47 -
 48
48 -
 49
49 -
 50
50 -
 51
51 -
 52
52 -
 53
53 -
 54
54 -
 55
55 -
56
-
57
-
58
-
59
-
60
-
61
-
62
-
63
-
64
-
65
-
66
-
67
-
68
-
69
-
70
-
71
-
72
-
73
-
74
-
75
-
76
-
77
-
78
-
79
-
80
-
81
-
82
-
83
-
84
-
85
-
86
-
87
-
88
-
89
-
90
-
91
-
92
-
93
-
94
-
95
-
96
-
97
-
98
-
99
-
100
-
101
-
102
-
103
-
104
-
105
-
106
-
107
-
108
-
109
-
110
-
111
-
112
-
113
-
114
-
115
-
116
-
117
-
118
-
119
-
120
-
121
-
122
-
123
-
124
-
125
-
126
-
127
-
128
-
129
-
130
-
131
-
132
-
133
-
134
-
135
-
136
-
137
-
138
-
139
-
140
-
141
-
142
-
143
-
144
-
145
-
146
-
147
-
148
-
149
-
150
-
151
-
152
-
153
-
154
-
155
-
156
-
157
-
158
-
159
-
160
-
161
-
162
-
163
-
164
-
165
-
166
-
167
-
168
-
169
-
170
-
171
-
172
-
173
-
174
-
175
-
176
-
177
-
178
-
179
-
180
-
181
-
182
-
183
-
184
-
185
-
186
-
187
-
188
-
189
-
190
-
191
-
192
-
193
-
194
-
195
-
196
-
197
 |
 |

44 Group Management Report
10 Group Management Report
10 A Review of the Financial Year
12
General EconomicEnvironment
15 Review of operations
38 BMW Stock and Bonds
41 Disclosures pursuant to §289 (4)
and §315 (4) HGB
43 Financial Analysis
43 – Internal Management System
44 – Earnings performance
46 – Financial position
48 – Net assets position
50 – Subsequent events report
50 – Value added statement
53 – Key performance figures
54 – Comments on BMW AG
58 Risk Management
62 Outlook
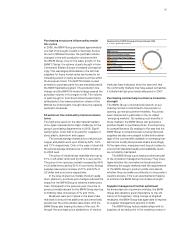
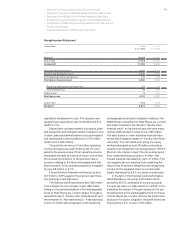
Group revenues rose by 5.0% compared to the
previous year. Adjusted for exchange rate factors,
group revenues would have increased by 5.5% or
euro 2,574 million. Revenues from the sale of BMW,
MINI and Rolls-Royce brand cars went up by1.9 %,
Revenues from motorcycles business grew by 3.1%.
Revenues from financial services business climbed
by19.0% due to higher business volumes. Revenues
from other activities of the Group totalled euro 193
million and related mainly to the softlab Group. The
comparable figure for the previous year was euro
119 million.
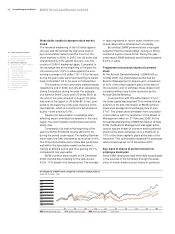
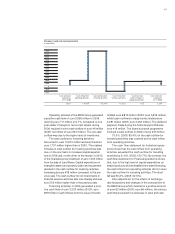
Revenue trends varied from region to region.
Whereas group revenues decreased in Germany by
3.6%, they increased in the rest of Europe by 6.8 %.
Revenues generated in the Americas region rose
by 6.7%. For the Africa, Asia and Oceania regions,
they grew in total by11.6%, mainly on the back of
marked sales volumes increases in specific Asian
markets.
Group cost of sales increased at a slightly lower
rate than revenues. The impact of additional costs
anticipated by the BMW Group since the beginning
of 2006 – namely the effect of unfavourable ex-
change rates and higher raw material prices – were
offset by efficiency improvements and an improved
product mix. Despite the adverse factors stated
above, gross profit increased in absolute terms by
6.3%, giving a gross profit percentage of 23.1%
(2005: 22.9 %). The gross profit percentage for both
Industrial operations and Financial operations was
0.6 percentage points lower than in the previous
year. Information about the composition of the sub-
groups is provided in Note [1].
Sales and administrative costs increased by
4.4% due to the higher business volume; the in-
crease was, however, lower than the increase in
revenues. They represented 10.1% of revenues,
0.1 percentage points lower on a year-to-year com-
parison.
Research and development costs were 3.2%
higher than in 2005, and represented 5.2% of
revenues (2005: 5.3%). Research and development
costs include amortisation of capitalised develop-
ment costs amounting to euro 872 million (2005:
euro 745 million). Total research and development
costs amounted to euro 3,208 million (2005: euro
3,115 million). This figure comprises research costs,
development costs not recognised as assets and
segment-specific rates of return as the key indicator
figures by which it manages operating performance.
For example, return on capital employed is used
as the main performance indicator for the Automo-
biles and Motorcycles segments. Return on sales
is also used as a performance indicator. The return
on assets is used for the group as a whole. In addition
to the return on assets, the Financial Services seg-
ment also manages its business using risk-based
performance indicators (e.g. Value at Risk).
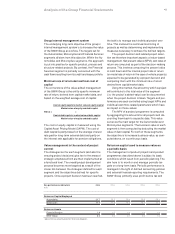
ROCE =Profit before financial result
Capital employed
ROA Group =Profit before interest expense and taxes
Balance sheet total
ROA Financial Services =Profit before tax
Net operating assets
Long-term creation of value
The overall target set for earnings is continuous
growth for which the group’s minimum rate of return
is used as the relevant performance indicator. These
periodic targets are supplementary to project and
programme targets.
In order to implement this comprehensive target
and management system, whilst at the same time
satisfying periodic reporting and accounting require-
ments, the model analyses show for each project
decision reached the impact of cash flows on the
NPV and on the model rate of return as well as the
impact on periodic earnings. This approach enables
the BMW Group to analyse the effect of each project-
based decision on business value (quantified in
terms of the NPV of the project programme) as well
as on annual earnings and rates of return. “Multi-
project planning” data gleaned from these
proce-
dures allows on-going comparison between dynamic
multi-period targets and periodic performance.
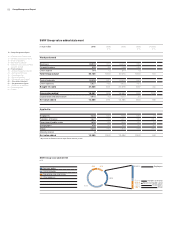
Earnings performance
The BMW Group recorded a net profit of euro 2,874
million (2005: euro 2,239 million) for the financial
year 2006. The post-tax return on sales was 5.9%
(2005: 4.8%). The group therefore generated earn-
ings per share of common stock of euro 4.38 and
earnings per share of preferred stock of euro 4.40.