Anthem Blue Cross 2001 Annual Report Download - page 64
Download and view the complete annual report
Please find page 64 of the 2001 Anthem Blue Cross annual report below. You can navigate through the pages in the report by either clicking on the pages listed below, or by using the keyword search tool below to find specific information within the annual report.-
 1
1 -
2
-
3
-
4
-
5
-
6
-
7
-
8
-
9
-
10
-
11
-
12
-
13
-
14
-
15
-
16
-
17
-
18
-
19
-
20
-
21
-
22
-
23
-
24
-
25
-
26
-
27
-
28
-
29
-
30
-
31
-
32
-
33
-
34
-
35
-
36
-
37
-
38
-
39
-
40
-
41
-
42
-
43
-
44
-
45
-
46
-
47
-
48
-
49
-
50
-
51
-
52
-
53
-
 54
54 -
 55
55 -
 56
56 -
 57
57 -
 58
58 -
 59
59 -
 60
60 -
 61
61 -
 62
62 -
 63
63 -
 64
64 -
 65
65 -
 66
66 -
 67
67 -
 68
68 -
 69
69 -
 70
70 -
 71
71 -
 72
72
 |
 |

62
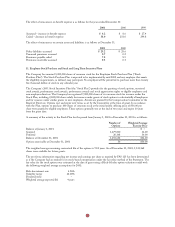
Through its participation in the Federal Employee Program, Medicare, Medicare at Risk, and TRICARE Program,
the Company generated approximately 20%, 22% and 23% of its total consolidated revenues from agencies of the U.S.
government for the years ended December 31, 2001, 2000 and 1999, respectively.
The Company defines operating revenues to include premium income, administrative fees and other revenues.
Operating revenues are derived from premiums and fees received primarily from the sale and administration of health
benefit products. Operating expenses are comprised of benefit and administrative expenses. The Company calculates
operating gain or loss as operating revenue less operating expenses.
The accounting policies of the segments are the same as those described in the summary of significant accounting
policies except that certain shared administrative expenses for each segment are recognized on a pro rata allocated
basis, which in aggregate approximates the consolidated expense. Any difference between the allocated expenses and
actual consolidated expense is included in other expenses not allocated to reportable segments. Intersegment sales
and expenses are recorded at cost, and eliminated in the consolidated financial statements. The Company evaluates
performance of the reportable segments based on operating gain or loss as defined above. The Company evaluates
investment income, interest expense, amortization expense and income taxes, and asset and liability details on a
consolidated basis as these items are managed in a corporate shared service environment and are not the responsibility
of segment operating management.
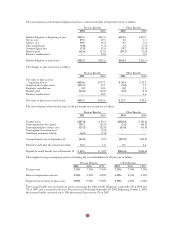
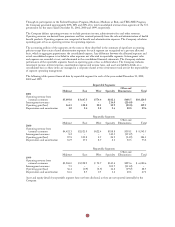
The following tables present financial data by reportable segment for each of the years ended December 31, 2001,
2000 and 1999:
Reportable Segments
Other and
Midwest East West Specialty Eliminations Total
2001
Operating revenue from
external customers $5,093.0 $3,667.3 $774.4 $182.1 $403.5 $10,120.3
Intersegment revenues – – – 214.0 (214.0) –
Operating gain (loss) 161.5 128.8 20.1 32.9 (23.8) 319.5
Depreciation and amortization 1.0 2.4 2.8 2.6 80.8 89.6
Reportable Segments
Other and
Midwest East West Specialty Eliminations Total
2000
Operating revenue from
external customers $4,452.3 $2,921.9 $622.4 $188.8 $358.1 $ 8,543.5
Intersegment revenues 8.2 – – 143.5 (151.7) –
Operating gain (loss) 87.8 103.8 2.5 24.9 (34.9) 184.1
Depreciation and amortization 16.9 17.1 8.7 2.1 30.5 75.3
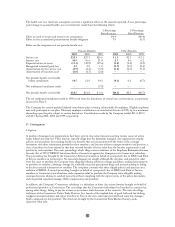
Reportable Segments
Other and
Midwest East West Specialty Eliminations Total
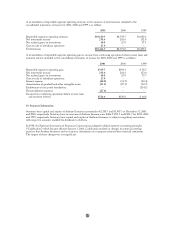
1999
Operating revenue from
external customers $3,968.0 $1,598.9 $ 72.7 $145.4 $295.6 $ 6,080.6
Intersegment revenues 7.5 – – 103.7 (111.2) –
Operating gain (loss) 36.4 (0.9) (3.5) 16.2 (19.7) 28.5
Depreciation and amortization 16.6 8.5 0.5 1.4 20.1 47.1
Asset and equity details by reportable segment have not been disclosed, as they are not reported internally by the
Company.