Anthem Blue Cross 2001 Annual Report Download - page 26
Download and view the complete annual report
Please find page 26 of the 2001 Anthem Blue Cross annual report below. You can navigate through the pages in the report by either clicking on the pages listed below, or by using the keyword search tool below to find specific information within the annual report.-
 1
1 -
2
-
3
-
4
-
5
-
6
-
7
-
8
-
9
-
10
-
11
-
12
-
13
-
14
-
15
-
 16
16 -
 17
17 -
 18
18 -
 19
19 -
 20
20 -
 21
21 -
 22
22 -
 23
23 -
 24
24 -
 25
25 -
 26
26 -
 27
27 -
 28
28 -
 29
29 -
 30
30 -
 31
31 -
 32
32 -
 33
33 -
 34
34 -
 35
35 -
 36
36 -
37
-
38
-
39
-
40
-
41
-
42
-
43
-
44
-
45
-
46
-
47
-
48
-
49
-
50
-
51
-
52
-
53
-
54
-
55
-
56
-
57
-
58
-
59
-
60
-
61
-
62
-
63
-
64
-
65
-
66
-
67
-
68
-
69
-
70
-
71
-
72
 |
 |

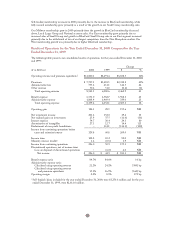
Growth in inpatient costs was nearly 10% during 2001, up from low-single digits in previous years. This
increase was due to re-negotiation of provider contracts and higher overall utilization, particularly for
cardiac services admissions. Hospitals have taken a more aggressive stance in their contracting with health
insurance companies as a result of reduced hospital reimbursements from Medicare and pressure to recover
the costs of additional investments in new medical technology and facilities.
Administrative expense increased $177.7 million, or 10%, in 2001, which includes the impacts of our
acquisition of BCBS-ME and the sale of our TRICARE business. Excluding our acquisition of BCBS-ME
and the sale of our TRICARE business, administrative expense increased $194.0 million, or 12%, primarily
due to higher commissions and premium taxes, which vary with premium, higher salary and benefit costs,
additional costs associated with higher membership and investments in technology. Our administrative
expense ratio, calculated using operating revenue and premium equivalents, decreased 120 basis points
primarily due to operating revenue increasing faster than administrative expense.
Net investment income increased $37.0 million, or 18%, primarily due to our higher investment portfolio
balances. The higher portfolio balances included net cash generated from operations, as well as cash
generated from improved balance sheet management, such as quicker collection of receivables and
liquidation of non-strategic assets. Excluding the investment income earned by BCBS-ME and TRICARE,
net investment income increased $31.7 million, or 16%. As returns on fixed maturity portfolios are
dependent on market interest rates and changes in interest rates are unpredictable, there is no certainty
that past investment performance will be repeated in the future.
Net realized capital gains increased from $25.9 million in 2000 to $60.8 million in 2001. Included in net
realized capital gains in 2001 was $65.2 million of gains resulting from restructuring our equity portfolio
into fixed maturity securities and equity index funds in the early to mid third quarter of 2001. This offset
$28.9 million of losses on equity securities that we recognized as other than temporary impairment during
the second quarter of 2001. Net realized capital gains from sale of equities decreased $4.8 million, or 11%,
to $38.7 million in 2001 from $43.5 million in 2000. Net realized capital gains from sale of fixed income
securities were $20.7 million in 2001, while we experienced net realized capital losses of $17.6 million in
2000. Net gains or losses on investments are influenced by market conditions when an investment is sold,
and will vary from year to year.
Gain on sale of subsidiary operations of $25.0 million relates to the sale of our TRICARE business on May
31, 2001.
Interest expense increased $5.5 million, or 10%, primarily reflecting the issuance of our 6.00% Equity
Security Units, or Units, on November 2, 2001 and the commitment fee associated with our new $800.0
million line of credit.
Amortization of intangibles increased $4.4 million, or 16%, from 2000 to 2001, primarily due to
amortization expense associated with our acquisition of BCBS-ME. As we adopted SFAS 142 on
January 1, 2002, this standard did not have any effect on these results. See Note 1 to our audited
consolidated financial statements for additional information.
Demutualization expenses, which are non-recurring, totaled $27.6 million in 2001.
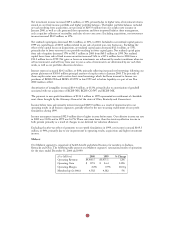
Income tax expense increased $81.2 million, or 79%, primarily due to higher income before taxes. Our
effective income tax rate in 2001 was 35.0% and was 31.0% in 2000. Our rate was lower than the statutory
effective tax rate in 2000 primarily as a result of changes in our deferred tax valuation allowance. Our
effective tax rate increased in 2001 primarily due to the non-deductibility of demutualization expenses and
a portion of goodwill amortization for income tax purposes.
Net income increased $116.2 million, or 51%, primarily due to the improvement in our operating results,
net realized capital gains, gain on sale of subsidiary operations and higher investment income. Excluding the
gain on the sale of our TRICARE business ($16.3 million after tax), net realized gains on investments and
demutualization expenses, net income increased $105.0 million, or 51%.
24