Anthem Blue Cross 2001 Annual Report Download - page 29
Download and view the complete annual report
Please find page 29 of the 2001 Anthem Blue Cross annual report below. You can navigate through the pages in the report by either clicking on the pages listed below, or by using the keyword search tool below to find specific information within the annual report.-
 1
1 -
2
-
3
-
4
-
5
-
6
-
7
-
8
-
9
-
10
-
11
-
12
-
13
-
14
-
15
-
16
-
17
-
18
-
 19
19 -
 20
20 -
 21
21 -
 22
22 -
 23
23 -
 24
24 -
 25
25 -
 26
26 -
 27
27 -
 28
28 -
 29
29 -
 30
30 -
 31
31 -
 32
32 -
 33
33 -
 34
34 -
 35
35 -
 36
36 -
 37
37 -
 38
38 -
 39
39 -
40
-
41
-
42
-
43
-
44
-
45
-
46
-
47
-
48
-
49
-
50
-
51
-
52
-
53
-
54
-
55
-
56
-
57
-
58
-
59
-
60
-
61
-
62
-
63
-
64
-
65
-
66
-
67
-
68
-
69
-
70
-
71
-
72
 |
 |

Operating revenue increased $63.8 million, or 19%, primarily due to higher revenue at APM. APM’s
operating revenue grew primarily due to increased mail order prescription volume and the implementation
of APM’s pharmacy benefit programs beginning in 2001 by BCBS-CO/NV and BCBS-ME, and in late
2000 by BCBS-NH. Mail service membership increased 28%, while retail service membership decreased
13%. Mail service prescription volume increased 38% and retail prescription volume increased 31%. This
growth more than offset the effect of the termination of a special funding arrangement with a large life
group on December 31, 2000. Life and disability premiums decreased $28.8 million, or 23%, primarily due
to this termination. This group accounted for $35.9 million of life and disability premiums for 2000 and
contributed very low margins to our Specialty segment’s profitability.
Operating gain increased $8.0 million, or 32%, primarily due to increased mail order prescription volume at
APM. Improved APM results, coupled with the termination of the large life group, resulted in an 80 basis
point increase in our operating margin to 8.3%.
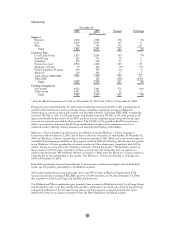
Other
Our Other segment includes various ancillary business units such as AdminaStar Federal, a subsidiary that
administers Medicare Parts A and B programs in Indiana, Illinois, Kentucky and Ohio, and Anthem
Alliance, a subsidiary that provided the health care benefits and administration in nine states for active and
retired military employees and their dependents under the Department of Defense’s TRICARE program for
military families until our TRICARE business was sold on May 31, 2001. Our Other segment also includes
intersegment revenue and expense eliminations and corporate expenses not allocated to operating segments.
The following table presents the summarized results of operations for our Other segment for the years
ended December 31, 2001 and 2000:
($ in Millions) 2001 2000 % Change
Operating Revenue $ 189.5 $ 206.4 (8)%
Operating Loss $ (23.8) $ (34.9) 32%)
Operating revenue decreased $16.9 million, or 8%, to $189.5 million in 2001. Excluding intersegment
operating revenue eliminations of $214.0 million in 2001 and $151.7 million in 2000, operating revenue
increased $42.6 million, or 12%, primarily due to an increase in premiums resulting from the additional risk
assumed as of January 1, 2001, by our TRICARE operations before its sale on May 31, 2001.
Certain corporate expenses are not allocated to our business segments. These unallocated expenses
accounted for $33.0 million in 2001 and $39.9 million in 2000, and primarily included such items as
unallocated incentive compensation associated with better than expected performance. Excluding
unallocated corporate expenses, operating gain was $9.2 million in 2001 versus $5.0 million in 2000.
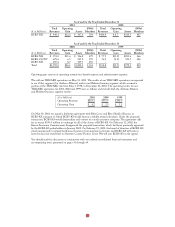
Membership – Year Ended December 31, 2000 Compared to Year Ended
December 31, 1999
Our membership data presented below are unaudited and in certain instances include our estimates of the
number of members at the end of the period rounded to the nearest thousand.
The following table presents membership data by segment, customer type and funding arrangement as
of December 31, 2000 and 1999, comparing both total and same-store membership. The membership
data presented are unaudited and in certain instances include our estimates of the number of members
represented by each contract at the end of the period, rounded to the nearest thousand. We define same-
store membership as our membership at a given year-end in a segment or for a particular customer or
funding type, after excluding the impact of members obtained through acquisitions or combinations during
such year. As such, we believe that same-store membership data best captures the rate of organic growth of
our operations year over year.
27