Anthem Blue Cross 2001 Annual Report Download - page 24
Download and view the complete annual report
Please find page 24 of the 2001 Anthem Blue Cross annual report below. You can navigate through the pages in the report by either clicking on the pages listed below, or by using the keyword search tool below to find specific information within the annual report.-
 1
1 -
2
-
3
-
4
-
5
-
6
-
7
-
8
-
9
-
10
-
11
-
12
-
13
-
 14
14 -
 15
15 -
 16
16 -
 17
17 -
 18
18 -
 19
19 -
 20
20 -
 21
21 -
 22
22 -
 23
23 -
 24
24 -
 25
25 -
 26
26 -
 27
27 -
 28
28 -
 29
29 -
 30
30 -
 31
31 -
 32
32 -
 33
33 -
 34
34 -
35
-
36
-
37
-
38
-
39
-
40
-
41
-
42
-
43
-
44
-
45
-
46
-
47
-
48
-
49
-
50
-
51
-
52
-
53
-
54
-
55
-
56
-
57
-
58
-
59
-
60
-
61
-
62
-
63
-
64
-
65
-
66
-
67
-
68
-
69
-
70
-
71
-
72
 |
 |

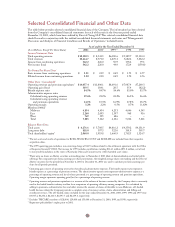
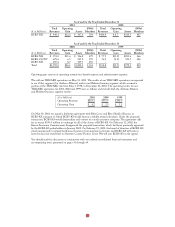
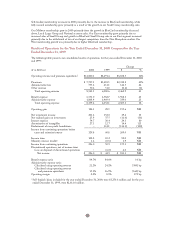
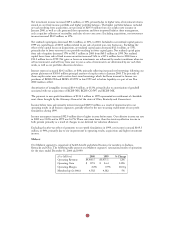
Results of Operations for the Year Ended December 31, 2001 Compared
to the Year Ended December 31, 2000
The following table presents our consolidated results of operations for the years ended December 31, 2001
and 2000:
Change
($ in Millions) 2001 2000 $ %
Operating revenue and premium equivalents1$14,057.4 $11,800.1 $2,257.3 19%
Premiums $ 9,244.8 $ 7,737.3 $1,507.5 19%
Administrative fees 817.3 755.6 61.7 8
Other revenue 58.2 50.6 7.6 15
Total operating revenue 10,120.3 8,543.5 1,576.8 18
Benefit expense 7,814.7 6,551.0 1,263.7 19
Administrative expense 1,986.1 1,808.4 177.7 10
Total operating expense 9,800.8 8,359.4 1,441.4 17
Operating gain 319.5 184.1 135.4 74
Net investment income 238.6 201.6 37.0 18
Net realized gains on investments 60.8 25.9 34.9 NM2
Gain on sale of subsidiary operations (TRICARE) 25.0 – 25.0 NM2
Interest expense 60.2 54.7 5.5 10
Amortization of intangibles 31.5 27.1 4.4 16
Demutualization expenses 27.6 – 27.6 NM2
Income before taxes and minority interest 524.6 329.8 194.8 59
Income taxes 183.4 102.2 81.2 79
Minority interest (credit) (1.0) 1.6 (2.6) NM2
Net income $ 342.2 $ 226.0 $116.2 51%
Benefit expense ratio384.5% 84.7% (20) bp4
Administrative expense ratio:5
Calculated using operating revenue619.6% 21.2% (160) bp4
Calculated using operating revenue
and premium equivalents714.1% 15.3% (120) bp4
Operating margin83.2% 2.2% 100 bp4
The following definitions are also applicable to all other tables and schedules in this discussion:
1Operating revenue and premium equivalents is a measure of the volume of business commonly used in the
health insurance industry to allow for a comparison of operating efficiency among companies. It is
obtained by adding to premiums, administrative fees and other revenue the amount of claims attributable
to non-Medicare, self-funded health business where we provide a complete array of customer service,
claims administration and billing and enrollment services. The self-funded claims included for the year
ended December 31, 2001 were $3,937.1 million and for the year ended December 31, 2000 were
$3,256.6 million.
2NM = Not meaningful.
3Benefit expense ratio = Benefit expense ÷ Premiums.
4bp = basis point; one hundred basis points = 1%.
5While we include two calculations of administrative expense ratio, we believe that administrative expense
ratio including premium equivalents is a better measure of efficiency as it eliminates changes
in the ratio caused by changes in our mix of insured and self-funded business. All discussions and
explanations related to administrative expense ratio will be related to administrative expense ratio
including premium equivalents.
6Administrative expense ÷ Operating revenue.
7Administrative expense ÷ Operating revenue and premium equivalents.
8Operating margin = Operating gain ÷ Total operating revenue.
22