Anthem Blue Cross 2001 Annual Report Download - page 51
Download and view the complete annual report
Please find page 51 of the 2001 Anthem Blue Cross annual report below. You can navigate through the pages in the report by either clicking on the pages listed below, or by using the keyword search tool below to find specific information within the annual report.-
 1
1 -
2
-
3
-
4
-
5
-
6
-
7
-
8
-
9
-
10
-
11
-
12
-
13
-
14
-
15
-
16
-
17
-
18
-
19
-
20
-
21
-
22
-
23
-
24
-
25
-
26
-
27
-
28
-
29
-
30
-
31
-
32
-
33
-
34
-
35
-
36
-
37
-
38
-
39
-
40
-
 41
41 -
 42
42 -
 43
43 -
 44
44 -
 45
45 -
 46
46 -
 47
47 -
 48
48 -
 49
49 -
 50
50 -
 51
51 -
 52
52 -
 53
53 -
 54
54 -
 55
55 -
 56
56 -
 57
57 -
 58
58 -
 59
59 -
 60
60 -
 61
61 -
62
-
63
-
64
-
65
-
66
-
67
-
68
-
69
-
70
-
71
-
72
 |
 |

49
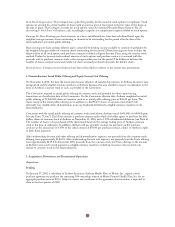
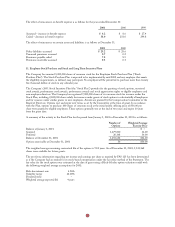
4. Endowment of Non-Profit Foundations
During 1999, Anthem Insurance reached agreements in the states of Kentucky, Ohio and Connecticut to resolve any
questions as to whether Anthem Insurance or the predecessor/successor entities were in possession of property that
was impressed with a charitable trust.
In 1999, contributions of $45.0, $28.0 and $41.1, were made for the benefit of charitable foundations in Kentucky,
Ohio, and Connecticut, respectively, from Anthem Insurance’s subsidiaries, Anthem Health Plans of Kentucky, Inc.,
Community Insurance Company and Anthem Health Plans, Inc., respectively.
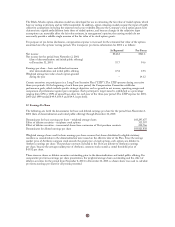
5. Investments
The following is a summary of available-for-sale investments:
Cost or Gross Gross
Amortized Unrealized Unrealized Fair
Cost Gains (Losses) Value
December 31, 2001
Fixed maturity securities:
United States Government
securities $ 684.7 $ 18.2 $ (4.7) $ 698.2
Obligations of states and
political subdivisions 3.7 0.1 – 3.8
Corporate securities 1,381.4 35.2 (10.3) 1,406.3
Mortgage-backed securities 1,744.3 33.5 (3.4) 1,774.4
Total fixed maturity securities 3,814.1 87.0 (18.4) 3,882.7
Equity securities 185.7 3.4 – 189.1
$3,999.8 $ 90.4 $ (18.4) $4,071.8
December 31, 2000
Fixed maturity securities:
United States Government
securities $ 723.4 $ 25.6 $ (2.5) $ 746.5
Obligations of states and
political subdivisions 0.8 – – 0.8
Corporate securities 1,041.4 19.4 (20.1) 1,040.7
Mortgage-backed securities 1,250.3 21.1 (13.0) 1,258.4
Preferred stocks 1.9 – (0.1) 1.8
Total fixed maturity securities 3,017.8 66.1 (35.7) 3,048.2
Equity securities 376.2 133.0 (46.1) 463.1
$3,394.0 $199.1 $ (81.8) $3,511.3
The amortized cost and fair value of fixed maturity securities at December 31, 2001, by contractual maturity, are
shown below. Expected maturities may be less than contractual maturities because the issuers of the securities may
have the right to prepay obligations without prepayment penalties.
Amortized Fair
Cost Value
Due in one year or less $ 51.6 $ 52.6
Due after one year through five years 589.7 606.6
Due after five years through ten years 833.3 845.5
Due after ten years 595.2 603.6
2,069.8 2,108.3
Mortgage-backed securities 1,744.3 1,774.4
$3,814.1 $3,882.7