Anthem Blue Cross 2001 Annual Report Download - page 19
Download and view the complete annual report
Please find page 19 of the 2001 Anthem Blue Cross annual report below. You can navigate through the pages in the report by either clicking on the pages listed below, or by using the keyword search tool below to find specific information within the annual report.-
 1
1 -
2
-
3
-
4
-
5
-
6
-
7
-
8
-
 9
9 -
 10
10 -
 11
11 -
 12
12 -
 13
13 -
 14
14 -
 15
15 -
 16
16 -
 17
17 -
 18
18 -
 19
19 -
 20
20 -
 21
21 -
 22
22 -
 23
23 -
 24
24 -
 25
25 -
 26
26 -
 27
27 -
 28
28 -
 29
29 -
30
-
31
-
32
-
33
-
34
-
35
-
36
-
37
-
38
-
39
-
40
-
41
-
42
-
43
-
44
-
45
-
46
-
47
-
48
-
49
-
50
-
51
-
52
-
53
-
54
-
55
-
56
-
57
-
58
-
59
-
60
-
61
-
62
-
63
-
64
-
65
-
66
-
67
-
68
-
69
-
70
-
71
-
72
 |
 |

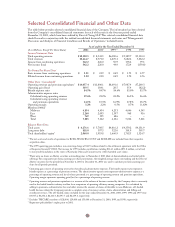
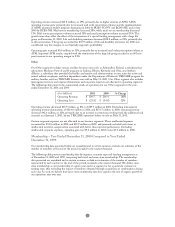
Selected Consolidated Financial and Other Data
The table below provides selected consolidated financial data of the Company. The information has been derived
from the Company’s consolidated financial statements for each of the years in the five year period ended
December 31, 2001, which have been audited by Ernst & Young LLP. This selected consolidated financial data
should be read in conjunction with the audited consolidated financial statements and notes and “Management’s
Discussion and Analysis of Financial Condition and Results of Operations” included herein.
As of and for the Year Ended December 31
($ in Millions, Except Per Share Data) 2001 2000119991, 2 1998 1997
Income Statement Data
Total operating revenue $10,120.3 $ 8,543.5 $6,080.6 $5,389.7 $5,110.0
Total revenues 10,444.7 8,771.0 6,270.1 5,682.4 5,332.2
Income from continuing operations 342.2 226.0 50.9 178.4 79.1
Net income (loss) 342.2 226.0 44.9 172.4 (159.0)
Pro Forma Per Share Data3
Basic income from continuing operations $ 3.31 $ 2.19 $ 0.49 $ 1.73 $ 0.77
Diluted income from continuing operations 3.30 2.18 0.49 1.72 0.76
Other Data – (unaudited)4
Operating revenue and premium equivalents5$14,057.4 $11,800.1 $8,691.6 $7,987.4 $7,269.3
Operating gain (loss) 319.5 184.1 28.5 35.4 (82.2)
Benefit expense ratio 84.5% 84.7% 84.6% 83.0% 83.7%
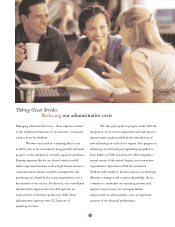
Administrative expense ratio:
Calculated using operating revenue 19.6% 21.2% 24.2% 26.3% 26.6%
Calculated using operating revenue
and premium equivalents 14.1% 15.3% 16.9% 17.8% 18.7%
Operating margin 3.2% 2.2% 0.5% 0.7% (1.6)%
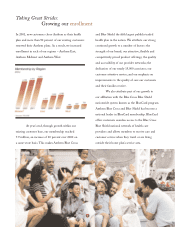
Members (000s)6
Midwest 4,854 4,454 4,253 4,046 4,345
East 2,260 2,093 1,397 968 916
West 769 595 486 – –
Total 7,883 7,142 6,136 5,014 5,261
Balance Sheet Data
Total assets $ 6,276.6 $ 5,708.5 $4,816.2 $4,359.2 $4,131.9
Long term debt 818.0 597.5 522.0 301.9 305.7
Total shareholders’ equity72,060.0 1,919.8 1,660.9 1,702.5 1,524.7
1The net assets and results of operations for BCBS-NH, BCBS-CO/NV and BCBS-ME are included from their respective
acquisition dates.
2The 1999 operating gain includes a non-recurring charge of $41.9 million related to the settlement agreement with the Office
of Inspector General (“OIG”). Net income for 1999 includes contributions totaling $114.1 million ($71.8 million, net of tax)
to non-profit foundations in the states of Kentucky, Ohio and Connecticut to settle charitable asset claims.
3There were no shares or dilutive securities outstanding prior to November 2, 2001 (date of demutualization and initial public
offering.) For comparative pro forma earnings per share presentation, the weighted average shares outstanding and the effect of
dilutive securities for the period from November 2, 2001 to December 31, 2001 was used to calculate pro forma earnings per
share for all periods presented.
4Operating gain consists of operating revenue less benefit and administrative expenses. The benefit expense ratio represents
benefit expense as a percentage of premium revenue. The administrative expense ratio represents administrative expense as a
percentage of operating revenue and has also been presented as a percentage of operating revenue and premium equivalents.
Operating margin represents operating gain (loss) as a percentage of operating revenue.
5Operating revenue and premium equivalents is a measure of the volume of business serviced by the Company that is commonly
used in the health benefits industry to allow for a comparison of operating efficiency among companies. It is calculated by
adding to premiums, administrative fees and other revenue the amount of claims attributable to non-Medicare, self-funded
health business where the Company provides a complete array of customer service, claims administration and billing and
enrollment services. The self-funded claims included for the years ended December 31, 2001, 2000, 1999, 1998 and 1997 were
$3,937.1, $3,256.6, $2,611.0, $2,597.7 and $2,159.3, respectively.
6Excludes TRICARE members of 128,000, 129,000 and 153,000 at December 31, 2000, 1999, and 1998, respectively.
7Represents policyholders’ surplus prior to 2001.
17