Anthem Blue Cross 2001 Annual Report Download - page 31
Download and view the complete annual report
Please find page 31 of the 2001 Anthem Blue Cross annual report below. You can navigate through the pages in the report by either clicking on the pages listed below, or by using the keyword search tool below to find specific information within the annual report.-
 1
1 -
2
-
3
-
4
-
5
-
6
-
7
-
8
-
9
-
10
-
11
-
12
-
13
-
14
-
15
-
16
-
17
-
18
-
19
-
20
-
 21
21 -
 22
22 -
 23
23 -
 24
24 -
 25
25 -
 26
26 -
 27
27 -
 28
28 -
 29
29 -
 30
30 -
 31
31 -
 32
32 -
 33
33 -
 34
34 -
 35
35 -
 36
36 -
 37
37 -
 38
38 -
 39
39 -
 40
40 -
 41
41 -
42
-
43
-
44
-
45
-
46
-
47
-
48
-
49
-
50
-
51
-
52
-
53
-
54
-
55
-
56
-
57
-
58
-
59
-
60
-
61
-
62
-
63
-
64
-
65
-
66
-
67
-
68
-
69
-
70
-
71
-
72
 |
 |

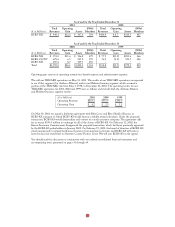
Self-funded membership increased in 2000 primarily due to the increase in BlueCard membership, while
fully insured membership grew primarily as a result of the growth in our Small Group membership sales.
Our Midwest membership grew in 2000 primarily from the growth in BlueCard membership discussed
above, Local Large Group and National accounts sales. Our East membership grew primarily due to
increased sales of Small Group and growth in BlueCard. Small Group sales in our East segment increased
primarily due to the withdrawal of two of our largest competitors from the New Hampshire market. Our
West membership growth was primarily due to higher BlueCard membership.
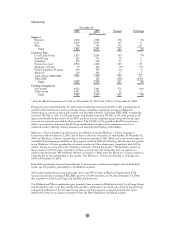
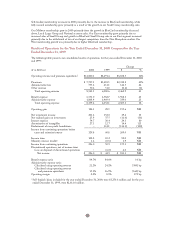
Results of Operations for the Year Ended December 31, 2000 Compared to the Year
Ended December 31, 1999
The following table presents our consolidated results of operations for the years ended December 31, 2000
and 1999:
Change
($ in Millions) 2000 1999 $ %
Operating revenue and premium equivalents1$11,800.1 $8,691.6 $3,108.5 36%
Premiums $ 7,737.3 $5,418.5 $2,318.8 43%
Administrative fees 755.6 611.1 144.5 24
Other revenue 50.6 51.0 (0.4) (1)
Total operating revenue 8,543.5 6,080.6 2,462.9 41
Benefit expense 6,551.0 4,582.7 1,968.3 43
Administrative expense 1,808.4 1,469.4 339.0 23
Total operating expense 8,359.4 6,052.1 2,307.3 38
Operating gain 184.1 28.5 155.6 NM
Net investment income 201.6 152.0 49.6 33
Net realized gains on investments 25.9 37.5 (11.6) (31)
Interest expense 54.7 30.4 24.3 80
Amortization of intangibles 27.1 12.7 14.4 113
Endowment of non-profit foundations –114.1 (114.1) (100)
Income from continuing operations before
taxes and minority interest 329.8 60.8 269.0 NM
Income taxes 102.2 10.2 92.0 NM
Minority interest (credit) 1.6 (0.3) 1.9 NM
Income from continuing operations 226.0 50.9 175.1 NM
Discontinued operations, net of income taxes
Loss on disposal of discontinued operations – (6.0) 6.0 NM
Net income $ 226.0 $ 44.9 $ 181.1 NM
Benefit expense ratio 84.7% 84.6% 10 bp
Administrative expense ratio:
Calculated using operating revenue 21.2% 24.2% (300) bp
Calculated using operating revenue
and premium equivalents 15.3% 16.9% (160) bp
Operating margin 2.2% 0.5% 170 bp
1Self-funded claims included for the year ended December 31, 2000, were $3,256.6 million and for the year
ended December 31, 1999, were $2,611.0 million.
29