Anthem Blue Cross 2001 Annual Report Download - page 54
Download and view the complete annual report
Please find page 54 of the 2001 Anthem Blue Cross annual report below. You can navigate through the pages in the report by either clicking on the pages listed below, or by using the keyword search tool below to find specific information within the annual report.-
 1
1 -
2
-
3
-
4
-
5
-
6
-
7
-
8
-
9
-
10
-
11
-
12
-
13
-
14
-
15
-
16
-
17
-
18
-
19
-
20
-
21
-
22
-
23
-
24
-
25
-
26
-
27
-
28
-
29
-
30
-
31
-
32
-
33
-
34
-
35
-
36
-
37
-
38
-
39
-
40
-
41
-
42
-
43
-
 44
44 -
 45
45 -
 46
46 -
 47
47 -
 48
48 -
 49
49 -
 50
50 -
 51
51 -
 52
52 -
 53
53 -
 54
54 -
 55
55 -
 56
56 -
 57
57 -
 58
58 -
 59
59 -
 60
60 -
 61
61 -
 62
62 -
 63
63 -
 64
64 -
65
-
66
-
67
-
68
-
69
-
70
-
71
-
72
 |
 |

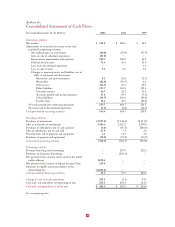
52
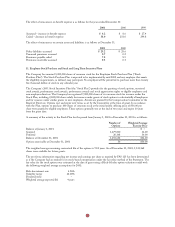
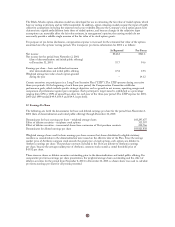
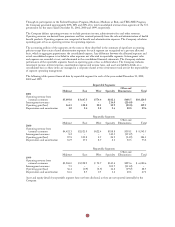
9. Unpaid Life, Accident and Health Claims
The following table provides a reconciliation of the beginning and ending balances for unpaid life, accident and
health claims:
2001 2000 1999
Balances at January 1, net of reinsurance $1,382.1 $1,052.6 $ 735.6
Business purchases (divestitures) (139.1) 113.9 190.4
Incurred related to:
Current year 7,894.1 6,593.6 4,608.9
Prior years (96.4) (60.1) (30.9)
Total incurred 7,797.7 6,533.5 4,578.0
Paid related to:
Current year 6,521.5 5,361.9 3,769.8
Prior years 1,115.5 956.0 681.6
Total paid 7,637.0 6,317.9 4,451.4
Balances at December 31, net of reinsurance 1,403.7 1,382.1 1,052.6
Reinsurance recoverables at December 31 7.6 29.0 109.2
Reserve gross of reinsurance recoverables on
unpaid claims at December 31 $1,411.3 $1,411.1 $1,161.8
Amounts incurred related to prior years vary from previously estimated liabilities as the claims are ultimately settled.
Negative amounts reported for incurred related to prior years resulted from claims being settled for amounts less than
originally estimated.
10. Reinsurance
The Company reinsures certain of its risks with other companies and assumes risk from other companies and such
reinsurance is accounted for as a transfer of risk. The Company is contingently liable for amounts recoverable from
the reinsurer in the event that it does not meet its contractual obligations.
The Company evaluates the financial condition of its reinsurers and monitors concentrations of credit risk arising
from similar geographic regions, activities, or economic characteristics of the reinsurers to minimize its exposure to
significant losses from reinsurer insolvencies.
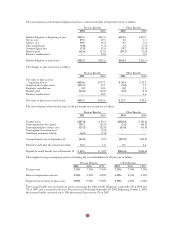
The details of net premiums written and earned are as follows for the years ended December 31:
2001 2000 1999
Written Earned Written Earned Written Earned
Consolidated:
Direct $9,325.7 $9,285.9 $7,993.0 $7,961.5 $5,674.8 $5,693.7
Assumed 1.6 1.7 0.7 1.9 23.9 26.9
Ceded (42.5) (42.8) (229.2) (226.1) (305.6) (302.1)
Net premiums $9,284.8 $9,244.8 $7,764.5 $7,737.3 $5,393.1 $5,418.5
Reportable segments:
Midwest $4,814.2 $4,774.2 $4,240.4 $4,203.1 $3,708.6 $3,729.3
East 3,462.5 3,462.5 2,753.0 2,768.9 1,490.3 1,495.4
West 716.1 716.1 571.1 569.6 64.5 64.2
Specialty 94.9 94.9 123.7 123.7 96.3 96.3
Other 197.1 197.1 76.3 72.0 33.4 33.3
Net premiums $9,284.8 $9,244.8 $7,764.5 $7,737.3 $5,393.1 $5,418.5