Anthem Blue Cross 2001 Annual Report Download - page 27
Download and view the complete annual report
Please find page 27 of the 2001 Anthem Blue Cross annual report below. You can navigate through the pages in the report by either clicking on the pages listed below, or by using the keyword search tool below to find specific information within the annual report.-
 1
1 -
2
-
3
-
4
-
5
-
6
-
7
-
8
-
9
-
10
-
11
-
12
-
13
-
14
-
15
-
16
-
 17
17 -
 18
18 -
 19
19 -
 20
20 -
 21
21 -
 22
22 -
 23
23 -
 24
24 -
 25
25 -
 26
26 -
 27
27 -
 28
28 -
 29
29 -
 30
30 -
 31
31 -
 32
32 -
 33
33 -
 34
34 -
 35
35 -
 36
36 -
 37
37 -
38
-
39
-
40
-
41
-
42
-
43
-
44
-
45
-
46
-
47
-
48
-
49
-
50
-
51
-
52
-
53
-
54
-
55
-
56
-
57
-
58
-
59
-
60
-
61
-
62
-
63
-
64
-
65
-
66
-
67
-
68
-
69
-
70
-
71
-
72
 |
 |

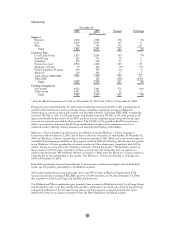
Midwest
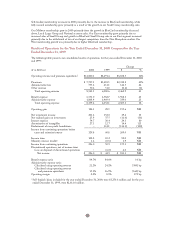
Our Midwest segment is comprised of health benefit and related business for members in Indiana,
Kentucky and Ohio. The following table presents our Midwest segment’s summarized results of operations
for the years ended December 31, 2001 and 2000:
($ in Millions) 2001 2000 % Change
Operating Revenue $5,093.0 $4,460.5 14%0
Operating Gain $ 161.5 $ 87.8 84%0
Operating Margin 3.2% 2.0% 120 bp
Membership (in 000s) 4,854 4,45419%0
1Excludes 128,000 TRICARE members
Operating revenue increased $632.5 million, or 14%, in 2001 due primarily to premium rate increases and
the effect of higher average membership in our Local Large Group, Small Group and Medicare + Choice
businesses.
Operating gain increased $73.7 million, or 84%, resulting in an operating margin of 3.2% at December 31,
2001, a 120 basis point improvement from the year ended December 31, 2000. This improvement was
primarily due to revenue growth and effective expense control. Administrative expense increased at a
slower rate than premiums as we gained operating efficiencies and leveraged our fixed costs over higher
membership.
Our Midwest segment assumed a portion of the risk for Anthem Alliance’s TRICARE contract until
December 31, 2000. Effective January 1, 2001, Anthem Alliance reassumed this risk. For the year ended
December 31, 2000, our Midwest segment received $122.1 million of premium income, no administrative
fees or other income, incurred $113.8 million of benefit expense and $7.4 million of administrative expense,
resulting in a $0.9 million operating gain on the TRICARE contract. We also had 128,000 TRICARE
members included in our Midwest segment’s membership at December 31, 2000, and no members at
December 31, 2001.
Excluding TRICARE, membership increased 400,000, or 9%, to 4.9 million members, primarily due to
sales in National business, higher BlueCard activity and favorable retention of business.
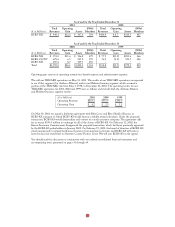
East
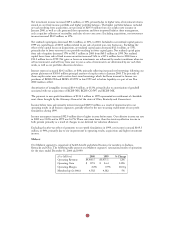
Our East segment is comprised of health benefit and related business for members in Connecticut, New
Hampshire and Maine. The following table presents our East segment’s summarized results of operations
for the years ended December 31, 2001 and 2000. BCBS-ME is included from its acquisition date of
June 5, 2000.
($ in Millions) 2001 2000 % Change
Operating Revenue $3,667.3 $2,921.9 26%0)
Operating Gain $ 128.8 $ 103.8 24%0
Operating Margin 3.5% 3.6% (10) bp
Membership (in 000s) 2,260 2,093 8%0)
Operating revenue increased $745.4 million, or 26%. Excluding our acquisition of BCBS-ME in June 2000
and the effect of our exit from the Medicare + Choice business in Connecticut on January 1, 2001,
operating revenue increased $449.0 million, or 20%, in 2001 due to premium rate increases in group
business and higher average membership. Increases in group membership accounted for most of our
increase and were primarily in our Local Large Group business.
25