Anthem Blue Cross 2001 Annual Report Download - page 25
Download and view the complete annual report
Please find page 25 of the 2001 Anthem Blue Cross annual report below. You can navigate through the pages in the report by either clicking on the pages listed below, or by using the keyword search tool below to find specific information within the annual report.-
 1
1 -
2
-
3
-
4
-
5
-
6
-
7
-
8
-
9
-
10
-
11
-
12
-
13
-
14
-
 15
15 -
 16
16 -
 17
17 -
 18
18 -
 19
19 -
 20
20 -
 21
21 -
 22
22 -
 23
23 -
 24
24 -
 25
25 -
 26
26 -
 27
27 -
 28
28 -
 29
29 -
 30
30 -
 31
31 -
 32
32 -
 33
33 -
 34
34 -
 35
35 -
36
-
37
-
38
-
39
-
40
-
41
-
42
-
43
-
44
-
45
-
46
-
47
-
48
-
49
-
50
-
51
-
52
-
53
-
54
-
55
-
56
-
57
-
58
-
59
-
60
-
61
-
62
-
63
-
64
-
65
-
66
-
67
-
68
-
69
-
70
-
71
-
72
 |
 |

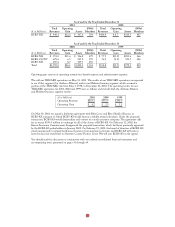
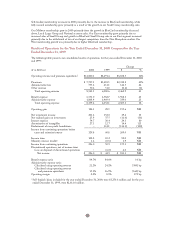
Premiums increased $1,507.5 million, or 19%, to $9,244.8 million in 2001 in part due to our acquisition of
BCBS-ME in June 2000 and the additional risk we recaptured as of January 1, 2001, associated with the
TRICARE business. Our subsidiary Anthem Alliance had retained 35% of the risk on its TRICARE
contract as of January 1, 2000, and we increased the retention as of January 1, 2001, to 90% of the total
risk for the contract. We sold the TRICARE business on May 31, 2001. Excluding our acquisition of
BCBS-ME and the sale of our TRICARE business, premiums increased $1,089.5 million, or 15%, due to
premium rate increases and higher membership in all of our business segments. Our Midwest premiums
increased due to higher membership and premium rate increases in our group accounts (both Local Large
Group and Small Group) and higher membership in Medicare + Choice. Our East and West premiums
increased primarily due to premium rate increases and higher membership in group business.
Administrative fees increased $61.7 million, or 8%, from $755.6 million in 2000 to $817.3 million in 2001,
with $30.2 million of this increase from our acquisition of BCBS-ME. Excluding our acquisition of
BCBS-ME and the sale of our TRICARE business, administrative fees increased $112.2 million, or 20%,
primarily from membership growth in National account self-funded business. Excluding our acquisition of
BCBS-ME and the sale of our TRICARE business, other revenue, which is comprised principally of
co-pays and deductibles associated with Anthem Prescription Management’s, or APM’s, sale of mail order
drugs, increased $12.1 million, or 27%. APM is our pharmacy benefit manager and provides its services to
other Anthem affiliates. Mail order revenues increased primarily due to additional volume resulting from the
introduction of APM as the pharmacy benefit manager at BCBS-NH in late 2000 and BCBS-CO/NV and
BCBS-ME in 2001.
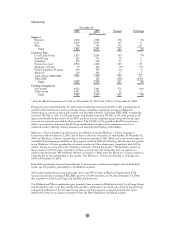
Benefit expense increased $1,263.7 million, or 19%, in 2001 due to our acquisition of BCBS-ME and the
additional risk assumed by Anthem Alliance for TRICARE business on January 1, 2001. Excluding our
acquisition of BCBS-ME and the sale of our TRICARE business, benefit expense increased $888.6 million,
or 15%, due to higher average membership and increasing cost of care. Cost of care trends were driven
primarily by higher utilization of outpatient services and higher prescription drug costs. Our benefit expense
ratio decreased 20 basis points from 84.7% in 2000 to 84.5% in 2001 primarily due to disciplined pricing,
implementation of disease management plans and improvement in provider contracting. Excluding our
acquisition of BCBS-ME and the sale of our TRICARE business, our benefit expense ratio decreased
40 basis points from 84.3% in 2000 to 83.9% in 2001 for the same reasons.
Total cost of care for 2001 increased approximately 13% from 2000. Excluding changes in our mix of
business between regions, total cost of care for 2001 increased approximately 12%. Outpatient and
professional services cost increases have varied among regions and products. For the year ended December
31, 2001, cost increases have generally averaged from 14% to 15% for outpatient services and from 11% to
12% for professional services. These increases resulted from both increased utilization and higher unit costs.
Increased outpatient utilization reflects an industry-wide trend toward a broader range of medical
procedures being performed without overnight hospital stays, as well as an increasing customer awareness
of and demand for diagnostic procedures such as magnetic resonance imagings, or MRIs. In addition,
improved medical technology has allowed more complicated medical procedures to be performed on an
outpatient basis rather than on an inpatient (hospitalized) basis, increasing both outpatient utilization rates
and unit costs.
Prescription drug cost increases for the year varied among regions and by product, but have generally
averaged from 16% to 17% in 2001 over 2000. The cost increases resulted from the introduction of new,
higher cost drugs and higher overall utilization as a result of increases in direct-to-consumer advertising by
pharmaceutical companies. In response to increasing prescription drug costs, we have implemented three-
tiered drug programs and expanded the use of formularies for our members. Three-tiered drug programs
reflect benefit designs that have three co-payment levels which depend on the drug selected. Generic drugs
have the lowest co-payment, brand name drugs included in the drug formulary have a higher co-payment,
and brand name drugs omitted from the drug formulary have the highest co-payment. Drug formularies
are a list of prescription drugs that have been reviewed and selected for their quality and efficacy by a
committee of practicing physicians and clinical pharmacists. Through our pharmacy benefit design, we
encourage use of these listed brand name and generic drugs to ensure members receive quality and cost-
effective medication.
23