Anthem Blue Cross 2001 Annual Report Download - page 39
Download and view the complete annual report
Please find page 39 of the 2001 Anthem Blue Cross annual report below. You can navigate through the pages in the report by either clicking on the pages listed below, or by using the keyword search tool below to find specific information within the annual report.-
 1
1 -
2
-
3
-
4
-
5
-
6
-
7
-
8
-
9
-
10
-
11
-
12
-
13
-
14
-
15
-
16
-
17
-
18
-
19
-
20
-
21
-
22
-
23
-
24
-
25
-
26
-
27
-
28
-
 29
29 -
 30
30 -
 31
31 -
 32
32 -
 33
33 -
 34
34 -
 35
35 -
 36
36 -
 37
37 -
 38
38 -
 39
39 -
 40
40 -
 41
41 -
 42
42 -
 43
43 -
 44
44 -
 45
45 -
 46
46 -
 47
47 -
 48
48 -
 49
49 -
50
-
51
-
52
-
53
-
54
-
55
-
56
-
57
-
58
-
59
-
60
-
61
-
62
-
63
-
64
-
65
-
66
-
67
-
68
-
69
-
70
-
71
-
72
 |
 |

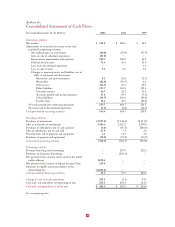
Year Ended December 31, 2000 Compared to Year Ended December 31, 1999
Net cash flow provided by operating activities was $684.5 million in 2000 and $219.8 million in 1999, an
increase of $464.7 million, or 211%. Significant growth occurred in the amount of net income, increased
depreciation and amortization expense related to acquisitions, amortization of a new claims and
administration system in our Midwest region and better balance sheet management resulting from our
conversion of certain operating assets, such as receivables and investments in non-strategic assets, to cash.
These activities contributed $256.4 million of additional operating cash in 2000. The year 1999 included
the following non-recurring disbursements of $156.0 million: payments for the settlement of charitable asset
claims in the states of Ohio, Kentucky and Connecticut and the settlement with the OIG, Health and
Human Services, with respect to BCBS-CT.
Net cash used in investing activities was $761.1 million in 2000 and $356.8 million in 1999, an increase of
$404.3 million, or 113%, primarily from our increased operating cash flow in 2000. Additionally, the net
cash we paid to acquire BCBS-ME and other purchase price adjustments paid with respect to prior
acquisitions in 2000 resulted in a decrease of approximately $161.7 million in cash used for investing
activities, as compared to 1999 when we purchased BCBS-NH and BCBS-CO/NV.
Net cash provided by financing activities was $75.5 million in 2000 and $220.1 million in 1999, a decrease
of $144.6 million or 66%. The cash provided in 2000 was the net proceeds received from our issuance of
$295.9 million of surplus notes on a discounted basis less $220.4 million repayment of bank debt.
Future Liquidity
Additional future liquidity needs may include acquisitions, operating expenses, common stock repurchases
and capital contributions to our subsidiaries and will include interest and contract fee payments on our
Units. We anticipate that we will purchase BCBS-KS with cash flow from current operations, pending the
outcome of the appeal of the Kansas Insurance Commissioner’s decision (see Note 21 to our audited
consolidated financial statments). We plan to utilize all or any combination of the following to fund our
liquidity needs: cash flow from operations, our investment portfolio, new borrowings under our credit
facilities, and future equity and debt offerings. Our source of liquidity would be determined at the time of
need, based on market conditions at that time. For additional information on our future debt and lease
commitments, see Notes 6 and 15 to our audited consolidated financial statements.
Investment Portfolio
Our investment portfolio is carried at fair value. As a result, we evaluate our investment securities on a
quarterly basis, using both quantitative and qualitative factors, to determine whether a decline in value is
other than temporary. If any declines are determined to be other than temporary, we charge the losses to
income. At December 31, 2001, we had gross unrealized gains of $90.4 million and gross unrealized losses
of $18.4 million, none of which were deemed to be other than temporary.
Dividends from Subsidiaries
The ability of our licensed insurance company subsidiaries to pay dividends to their parent companies is
limited by regulations in their respective states of domicile. Generally, dividends in any 12-month period are
limited to the greater or lesser (depending on state statute) of the prior year’s statutory net income or 10%
of statutory surplus. Dividends in excess of this amount are classified as extraordinary and require prior
approval of the respective departments of insurance. Further, an insurance company may not pay a dividend
unless, after such payment, its surplus is reasonable in relation to its outstanding liabilities and adequate to
meet its financial needs, as determined by the department of insurance.
37