Anthem Blue Cross 2001 Annual Report Download - page 33
Download and view the complete annual report
Please find page 33 of the 2001 Anthem Blue Cross annual report below. You can navigate through the pages in the report by either clicking on the pages listed below, or by using the keyword search tool below to find specific information within the annual report.-
 1
1 -
2
-
3
-
4
-
5
-
6
-
7
-
8
-
9
-
10
-
11
-
12
-
13
-
14
-
15
-
16
-
17
-
18
-
19
-
20
-
21
-
22
-
 23
23 -
 24
24 -
 25
25 -
 26
26 -
 27
27 -
 28
28 -
 29
29 -
 30
30 -
 31
31 -
 32
32 -
 33
33 -
 34
34 -
 35
35 -
 36
36 -
 37
37 -
 38
38 -
 39
39 -
 40
40 -
 41
41 -
 42
42 -
 43
43 -
44
-
45
-
46
-
47
-
48
-
49
-
50
-
51
-
52
-
53
-
54
-
55
-
56
-
57
-
58
-
59
-
60
-
61
-
62
-
63
-
64
-
65
-
66
-
67
-
68
-
69
-
70
-
71
-
72
 |
 |

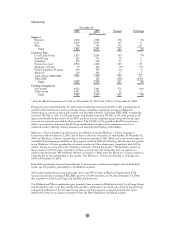
Net investment income increased $49.6 million, or 33%, primarily due to higher rates of investment returns
earned on our fixed income portfolio and higher portfolio balances. The higher portfolio balances included
net cash resulting from acquisitions, net proceeds of $295.9 million from our surplus note issuance in
January 2000, as well as cash generated from operations and from improved balance sheet management,
such as quicker collection of receivables and sales of non-core assets. Excluding acquisitions, net investment
income increased $24.9 million, or 17%.
Net realized capital gains decreased $11.6 million, or 31%, in 2000. Included in net realized capital gains in
1999 are capital losses of $20.5 million related to our sale of several non-core businesses. Excluding the
effect of the capital losses on dispositions, net realized capital gains decreased $32.1 million, or 55%,
primarily due to lower turnover in our portfolio resulting in fewer capital gains. Net realized capital gains
from sale of equities decreased 37% to $43.5 million in 2000 from $69.3 million in 1999. Net realized
capital losses from sale of fixed income securities increased 56% to a $17.6 million loss in 2000 from a
$11.3 million loss in 1999. Net gains or losses on investments are influenced by market conditions when we
sell an investment, and will vary from year to year as sales of investments are determined by our cash flow
needs, as well as our portfolio allocation decisions.
Interest expense increased $24.3 million, or 80%, primarily reflecting increased net borrowings following our
private placement of $300.0 million principal amount of surplus notes in January 2000. The proceeds of
those surplus notes were used to retire short-term borrowings which had been incurred to finance our
purchases of BCBS-NH and BCBS-CO/NV in late 1999 and to bolster liquidity as a part of our Year
2000 readiness effort.
Amortization of intangibles increased $14.4 million, or 113%, primarily due to amortization of goodwill
associated with our acquisitions of BCBS-NH, BCBS-CO/NV and BCBS-ME.
The payment to non-profit foundations of $114.1 million in 1999 represented our settlement of charitable
asset claims brought by the Attorneys General of the states of Ohio, Kentucky and Connecticut.
Income before taxes and minority interest increased $269.0 million as a result of improvement in our
operating results in all business segments, partially offset by the non-recurring endowment of non-profit
foundations during 1999.
Income tax expense increased $92.0 million due to higher income before taxes. Our effective income tax rate
in 2000 was 31.0% and in 1999 was 16.7%. These rates were lower than the statutory effective tax rate in
both periods primarily as a result of changes in our deferred tax valuation allowance.
Excluding the after-tax effect of payments to non-profit foundations in 1999, net income increased $109.3
million, or 94%, primarily due to our improvement in operating results, acquisitions and higher investment
income.
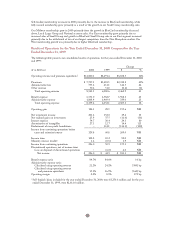
Midwest
Our Midwest segment is comprised of health benefit and related business for members in Indiana,
Kentucky and Ohio. The following table presents our Midwest segment’s summarized results of operations
for the years ended December 31, 2000 and 1999:
($ in Millions) 2000 1999 % Change
Operating Revenue $4,460.5 $3,975.5 12%0
Operating Gain $ 87.8 $ 36.4 141%0
Operating Margin 2.0% 0.9% 110 bp
Membership (in 000s) 4,582 4,382 5%0
31