Anthem Blue Cross 2001 Annual Report Download - page 3
Download and view the complete annual report
Please find page 3 of the 2001 Anthem Blue Cross annual report below. You can navigate through the pages in the report by either clicking on the pages listed below, or by using the keyword search tool below to find specific information within the annual report.-
 1
1 -
 2
2 -
 3
3 -
 4
4 -
 5
5 -
 6
6 -
 7
7 -
 8
8 -
 9
9 -
 10
10 -
 11
11 -
 12
12 -
 13
13 -
 14
14 -
15
-
16
-
17
-
18
-
19
-
20
-
21
-
22
-
23
-
24
-
25
-
26
-
27
-
28
-
29
-
30
-
31
-
32
-
33
-
34
-
35
-
36
-
37
-
38
-
39
-
40
-
41
-
42
-
43
-
44
-
45
-
46
-
47
-
48
-
49
-
50
-
51
-
52
-
53
-
54
-
55
-
56
-
57
-
58
-
59
-
60
-
61
-
62
-
63
-
64
-
65
-
66
-
67
-
68
-
69
-
70
-
71
-
72
 |
 |

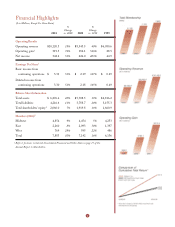
Financial Highlights
($ in Millions, Except Per Share Data)
%%
Change Change
2001 vs. 2000 2000 vs. 1999 1999
Operating Results
Operating revenue $10,120.3 18% $ 8,543.5 40% $6,080.6
Operating gain1319.5 74% 184.1 546% 28.5
Net income 342.2 51% 226.0 403% 44.9
Earnings Per Share1
Basic income from
continuing operations $ 3.31 51% $ 2.19 347% $ 0.49
Diluted income from
continuing operations 3.30 51% 2.18 345% 0.49
Balance Sheet Information
Total assets $ 6,276.6 10% $ 5,708.5 19% $4,816.2
Total liabilities 4,216.6 11% 3,788.7 20% 3,155.3
Total shareholders’ equity12,060.0 7% 1,919.8 16% 1,660.9
Members (000s)1
Midwest 4,854 9% 4,454 5% 4,253
East 2,260 8% 2,093 50% 1,397
West 769 29% 595 22% 486
Total 7,883 10% 7,142 16% 6,136
1Refer to footnotes to Selected Consolidated Financial and Other Data on page 17 of this
Annual Report to Shareholders.
1