Advance Auto Parts 2015 Annual Report Download - page 97
Download and view the complete annual report
Please find page 97 of the 2015 Advance Auto Parts annual report below. You can navigate through the pages in the report by either clicking on the pages listed below, or by using the keyword search tool below to find specific information within the annual report.-
 1
1 -
2
-
3
-
4
-
5
-
6
-
7
-
8
-
9
-
10
-
11
-
12
-
13
-
14
-
15
-
16
-
17
-
18
-
19
-
20
-
21
-
22
-
23
-
24
-
25
-
26
-
27
-
28
-
29
-
30
-
31
-
32
-
33
-
34
-
35
-
36
-
37
-
38
-
39
-
40
-
41
-
42
-
43
-
44
-
45
-
46
-
47
-
48
-
49
-
50
-
51
-
52
-
53
-
54
-
55
-
56
-
57
-
58
-
59
-
60
-
61
-
62
-
63
-
64
-
65
-
66
-
67
-
68
-
69
-
70
-
71
-
72
-
73
-
74
-
75
-
76
-
77
-
78
-
79
-
80
-
81
-
82
-
83
-
84
-
85
-
86
-
 87
87 -
 88
88 -
 89
89 -
 90
90 -
 91
91 -
 92
92 -
 93
93 -
 94
94 -
 95
95 -
 96
96 -
 97
97 -
 98
98 -
 99
99 -
 100
100 -
 101
101 -
 102
102 -
 103
103 -
 104
104 -
 105
105 -
 106
106 -
 107
107 -
108
-
109
-
110
-
111
-
112
 |
 |

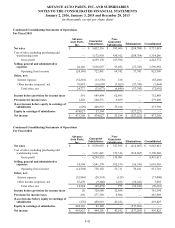
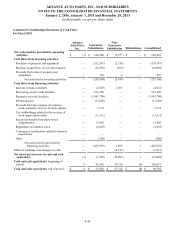
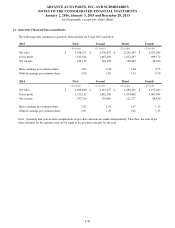
ADVANCE AUTO PARTS, INC. AND SUBSIDIARIES
NOTES TO THE CONSOLIDATED FINANCIAL STATEMENTS
January 2, 2016, January 3, 2015 and December 28, 2013
(in thousands, except per share data)
F-43
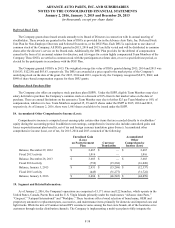
Condensed Consolidating Statements of Comprehensive Income
For Fiscal 2015
Advance
Auto Parts,
Inc.
Guarantor
Subsidiaries
Non-
Guarantor
Subsidiaries Eliminations Consolidated
Net income $ 473,398 $ 474,027 $ 53,194 $ (527,221) $ 473,398
Other comprehensive loss:
Changes in net unrecognized other
postretirement benefit costs — (445)— —
(445)
Currency translation — — (31,277)—
(31,277)
Equity in other comprehensive loss of
subsidiaries (31,722) (31,277) — 62,999 —
Other comprehensive loss (31,722) (31,722)(31,277) 62,999 (31,722)
Comprehensive income $ 441,676 $ 442,305 $ 21,917 $ (464,222) $ 441,676
Condensed Consolidating Statements of Comprehensive Income
For Fiscal 2014
Advance
Auto Parts,
Inc.
Guarantor
Subsidiaries
Non-
Guarantor
Subsidiaries Eliminations Consolidated
Net income $ 493,825 $ 494,101 $ 43,182 $ (537,283) $ 493,825
Other comprehensive loss:
Changes in net unrecognized other
postretirement benefit costs — (752)— —
(752)
Currency translation adjustments — — (15,268)—
(15,268)
Equity in other comprehensive loss of
subsidiaries (16,020) (15,268) — 31,288 —
Other comprehensive loss (16,020) (16,020)(15,268) 31,288 (16,020)
Comprehensive income $ 477,805 $ 478,081 $ 27,914 $ (505,995) $ 477,805