Advance Auto Parts 2015 Annual Report Download - page 91
Download and view the complete annual report
Please find page 91 of the 2015 Advance Auto Parts annual report below. You can navigate through the pages in the report by either clicking on the pages listed below, or by using the keyword search tool below to find specific information within the annual report.-
 1
1 -
2
-
3
-
4
-
5
-
6
-
7
-
8
-
9
-
10
-
11
-
12
-
13
-
14
-
15
-
16
-
17
-
18
-
19
-
20
-
21
-
22
-
23
-
24
-
25
-
26
-
27
-
28
-
29
-
30
-
31
-
32
-
33
-
34
-
35
-
36
-
37
-
38
-
39
-
40
-
41
-
42
-
43
-
44
-
45
-
46
-
47
-
48
-
49
-
50
-
51
-
52
-
53
-
54
-
55
-
56
-
57
-
58
-
59
-
60
-
61
-
62
-
63
-
64
-
65
-
66
-
67
-
68
-
69
-
70
-
71
-
72
-
73
-
74
-
75
-
76
-
77
-
78
-
79
-
80
-
 81
81 -
 82
82 -
 83
83 -
 84
84 -
 85
85 -
 86
86 -
 87
87 -
 88
88 -
 89
89 -
 90
90 -
 91
91 -
 92
92 -
 93
93 -
 94
94 -
 95
95 -
 96
96 -
 97
97 -
 98
98 -
 99
99 -
 100
100 -
 101
101 -
102
-
103
-
104
-
105
-
106
-
107
-
108
-
109
-
110
-
111
-
112
 |
 |

ADVANCE AUTO PARTS, INC. AND SUBSIDIARIES
NOTES TO THE CONSOLIDATED FINANCIAL STATEMENTS
January 2, 2016, January 3, 2015 and December 28, 2013
(in thousands, except per share data)
F-37
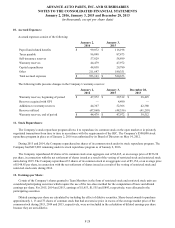
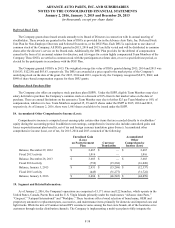
Compensation expense for performance-based awards of $14,659, $6,161, and $1,141 in 2015, 2014 and 2013,
respectively, was determined based on management’s estimate of the probable vesting outcome.
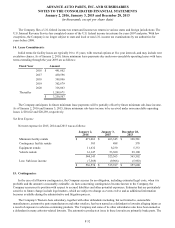
Performance-Based SARs
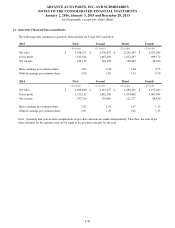
The following table summarizes the performance-based SARs activity for 2015:
Number of
Awards
Weighted-
Average
Exercise Price
Weighted-
Average
Remaining
Contractual
Term (in years)
Aggregate
Intrinsic Value
Outstanding at January 3, 2015 629 $ 112.01
Granted 198 153.22
Change in units based on performance 96 95.59
Exercised (70) 35.84
Forfeited (100) 120.42
Outstanding at January 2, 2016 753 $ 118.89 5.41 $ 24,225
Vested and expected to vest 662 $ 114.93 5.24 $ 23,870
Outstanding and exercisable 32 $ 56.10 2.11 $ 3,031
The weighted average fair value of performance-based SARs granted during 2015, 2014 and 2013 was $43.38, $32.41 and
$23.72 per share, respectively. The aggregate intrinsic value of performance-based SARs exercised during 2015, 2014 and 2013
was $8,475, $3,814 and $14,257, respectively. As of January 2, 2016, the maximum potential payout under the Company’s
currently outstanding performance-based SAR awards was 1,813 units.
Performance-Based Restricted Stock Units
The following table summarizes the performance-based RSUs activity for 2015:
Number of Awards
Weighted-Average
Grant Date Fair Value
Nonvested at January 3, 2015 195 $ 81.98
Granted — —
Change in units based on performance 33 72.17
Vested (24) 75.00
Forfeited (21) 76.04
Nonvested at January 2, 2016 183 $ 81.81
The fair value of each performance-based RSU is determined based on the market price of the Company’s common stock
on the date of grant. The weighted average fair value of performance-based RSUs granted during 2014 and 2013 was $123.32
and $77.47 per share, respectively. No performance-based RSUs were granted in 2015. The total grant date fair value of
performance-based restricted stock vested during 2015, 2014 and 2013 was $1,763, $142 and $1,290, respectively. As of
January 2, 2016, the maximum potential payout under the Company’s currently outstanding performance-based RSUs was 309
shares.