Advance Auto Parts 2015 Annual Report Download - page 36
Download and view the complete annual report
Please find page 36 of the 2015 Advance Auto Parts annual report below. You can navigate through the pages in the report by either clicking on the pages listed below, or by using the keyword search tool below to find specific information within the annual report.-
 1
1 -
2
-
3
-
4
-
5
-
6
-
7
-
8
-
9
-
10
-
11
-
12
-
13
-
14
-
15
-
16
-
17
-
18
-
19
-
20
-
21
-
22
-
23
-
24
-
25
-
 26
26 -
 27
27 -
 28
28 -
 29
29 -
 30
30 -
 31
31 -
 32
32 -
 33
33 -
 34
34 -
 35
35 -
 36
36 -
 37
37 -
 38
38 -
 39
39 -
 40
40 -
 41
41 -
 42
42 -
 43
43 -
 44
44 -
 45
45 -
 46
46 -
47
-
48
-
49
-
50
-
51
-
52
-
53
-
54
-
55
-
56
-
57
-
58
-
59
-
60
-
61
-
62
-
63
-
64
-
65
-
66
-
67
-
68
-
69
-
70
-
71
-
72
-
73
-
74
-
75
-
76
-
77
-
78
-
79
-
80
-
81
-
82
-
83
-
84
-
85
-
86
-
87
-
88
-
89
-
90
-
91
-
92
-
93
-
94
-
95
-
96
-
97
-
98
-
99
-
100
-
101
-
102
-
103
-
104
-
105
-
106
-
107
-
108
-
109
-
110
-
111
-
112
 |
 |

23
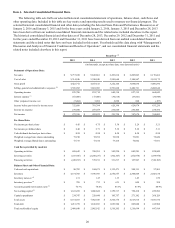
Management Overview
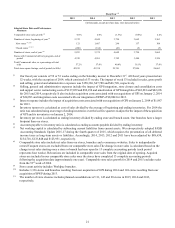
We generated diluted earnings per share, or diluted EPS, of $6.40 during 2015 compared to $6.71 for 2014. The decrease
in our diluted EPS was driven primarily by costs associated with the integration of GPI, store closure and consolidation costs
and support center restructuring costs. In addition, the prior year benefited from an additional week of operations due to our 53-
week fiscal year. When adjusted for the following comparable adjustments, our comparable diluted earnings per share
("Comparable Cash EPS") in 2015 was $7.82 compared to $7.59 during 2014:
2015 2014
GPI integration, store closure and consolidation, and support center
restructuring costs $ 1.07 $ 0.69
Amortization related to the acquired intangible assets from GPI $ 0.35 $ 0.36
53rd Week of 2014 $ — $ (0.17)
Refer to the "Reconciliation of Non-GAAP Financial Measures" section for further details of our comparable adjustments.
Excluding the impact of the 53rd week of 2014, total sales for 2015 increased 0.4% over 2014 and comparable store sales
were flat. Our sales results decelerated in the second half of the year due to the impact of GPI integration activities and the
negative impact of warmer weather late in the year. We began 2015 with an aggressive plan to complete a large part of our
integration of GPI during 2015, and we completed several parts of the integration, including 240 Carquest store consolidations
and conversions, support center consolidations, the integration of our field teams and pricing alignment. The multitude of
changes proved to be more challenging than anticipated and disrupted two key areas of our operations - (i) customer service
levels and (ii) inventory availability.
In addition to integrating the Carquest operations, we are also focused on achieving the cost synergies expected from the
acquisition and on other cost control initiatives. In 2015, we achieved approximately $110.0 million of planned acquisition
synergies, which was $50 million incremental to 2014. In addition, we closed 79 underperforming stores during the fourth
quarter of 2015, which is expected to drive productivity improvements in the near future. During 2016, we plan to drive
additional cost reduction and pursue opportunities to increase efficiency across our operations.
2015 Highlights
A high-level summary of our financial results and other highlights from our 2015 include:
• Total sales during 2015 decreased 1.1% to $9,737.0 million as compared to 2014. This decrease was primarily driven
by $150.4 million in sales from the 53rd week of 2014 and store consolidations and closures, partially offset by new
store openings.
• Our operating income for 2015 was $825.8 million, a decrease of $25.9 million from 2014. As a percentage of total
sales, operating income was 8.5%, a decrease of 17 basis points as compared to 2014, due to an increase in our SG&A
rate partially offset by a higher gross profit rate.
• Our inventory balance as of January 2, 2016 increased $237.8 million, or 6.0%, over the prior year driven mainly by
transitional inventory growth resulting from our product integration and the consolidation of our Carquest stores and
the opening of new stores and branches.
• We generated operating cash flow of $689.6 million during 2015, a decrease of 2.7% compared to 2014, primarily due
to a decrease in net income, partially offset by changes in working capital.
• We consolidated 80 and converted 160 Carquest stores into Advance Auto Parts stores and aligned our products and
pricing in our Advance Auto Parts and Carquest stores.
Refer to the “Consolidated Results of Operations” and “Liquidity and Capital Resources” sections for further details of
our income statement and cash flow results, respectively.