Advance Auto Parts 2015 Annual Report Download - page 40
Download and view the complete annual report
Please find page 40 of the 2015 Advance Auto Parts annual report below. You can navigate through the pages in the report by either clicking on the pages listed below, or by using the keyword search tool below to find specific information within the annual report.-
 1
1 -
2
-
3
-
4
-
5
-
6
-
7
-
8
-
9
-
10
-
11
-
12
-
13
-
14
-
15
-
16
-
17
-
18
-
19
-
20
-
21
-
22
-
23
-
24
-
25
-
26
-
27
-
28
-
29
-
 30
30 -
 31
31 -
 32
32 -
 33
33 -
 34
34 -
 35
35 -
 36
36 -
 37
37 -
 38
38 -
 39
39 -
 40
40 -
 41
41 -
 42
42 -
 43
43 -
 44
44 -
 45
45 -
 46
46 -
 47
47 -
 48
48 -
 49
49 -
 50
50 -
51
-
52
-
53
-
54
-
55
-
56
-
57
-
58
-
59
-
60
-
61
-
62
-
63
-
64
-
65
-
66
-
67
-
68
-
69
-
70
-
71
-
72
-
73
-
74
-
75
-
76
-
77
-
78
-
79
-
80
-
81
-
82
-
83
-
84
-
85
-
86
-
87
-
88
-
89
-
90
-
91
-
92
-
93
-
94
-
95
-
96
-
97
-
98
-
99
-
100
-
101
-
102
-
103
-
104
-
105
-
106
-
107
-
108
-
109
-
110
-
111
-
112
 |
 |

27
unseasonably warm start to winter impacted both our Commercial and DIY business, particularly in batteries and cold weather-
related hard parts categories such as starters, alternators and related products.
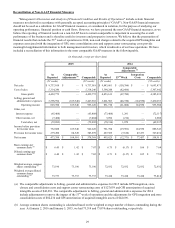
Gross Profit
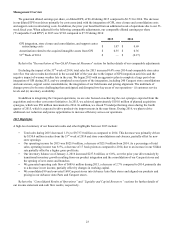
Gross profit for 2015 was $4,422.8 million, or 45.4% of net sales, as compared to $4,453.6 million, or 45.2% of net sales,
in 2014, an increase of 18 basis points. The increase in gross profit as a percentage of net sales was primarily the result of lower
product acquisition costs, inclusive of merchandise synergies as a result of the acquisition of GPI.
SG&A Expenses
SG&A expenses for 2015 were $3,597.0 million, or 36.9% of net sales, as compared to $3,601.9 million, or 36.6% of net
sales, for 2014, an increase of 35 basis points. This increase as a percentage of net sales was primarily due to an increase in GPI
integration costs, store closure and consolidation expenses and support center restructuring costs. Excluding these costs, SG&A
decreased 18 basis points as a percent of sales compared to the prior year driven by lower administrative costs and incentive
compensation as well as lower delivery costs as fuel prices have declined. These benefits were partially offset by expense
deleverage as a result of softer sales. See "Reconciliation of Non-GAAP Financial Measures" section for further details of our
comparable adjustments.
Operating Income
Operating income for 2015 was $825.8 million, representing 8.5% of net sales, as compared to $851.7 million, or 8.7% of
net sales, for 2014, a decrease of 17 basis points. This decrease was due to a higher SG&A rate, partially offset by an increase
in our gross profit rate. These changes on a rate basis were due to the gross profit and SG&A drivers previously discussed.
Interest Expense
Interest expense for 2015 was $65.4 million, or 0.7% of net sales, as compared to $73.4 million, or 0.7% of net sales, in
2014. The decrease in interest expense was due to repayments made on our credit facility over the last year.
Income Taxes
Income tax expense for 2015 was $279.5 million, as compared to $287.6 million for 2014. Our effective income tax rate
was 37.1% and 36.8% for 2015 and 2014, respectively. Our income tax rates in both 2015 and 2014 reflect favorable income
tax settlements and statute of limitation expirations.
Net Income
Net income was $473.4 million, or $6.40 per diluted share, for 2015 as compared to $493.8 million, or $6.71 per diluted
share, for 2014. As a percentage of net sales, net income for 2015 was 4.9%, as compared to 5.0% for 2014. The decrease in
diluted EPS was driven primarily by the decrease in net income.
2014 Compared to 2013
Net Sales
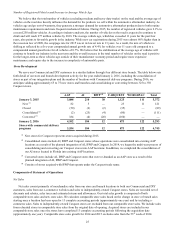
Net sales for 2014 were $9,843.9 million, an increase of $3,350.0 million, or 51.6%, over net sales for 2013. This growth
was primarily due to net sales of $3,040.5 million from the acquired GPI operations, $150.4 million in sales from the 53rd week,
comparable store sales of 2.0% and sales from new stores opened during 2014. Our comparable store sales increase reflected
stronger performance from Commercial sales driven by increases in both traffic and average transaction amount, partially offset
by a decrease in DIY sales driven by lower traffic count. Our overall transaction value increased primarily due to higher priced
products sold and a higher mix of Commercial sales.
2014 2013
Comparable Store Sales % 2.0% (1.5)%
Net Stores Added (excluding GPI stores) 124 151