Advance Auto Parts 2015 Annual Report Download - page 100
Download and view the complete annual report
Please find page 100 of the 2015 Advance Auto Parts annual report below. You can navigate through the pages in the report by either clicking on the pages listed below, or by using the keyword search tool below to find specific information within the annual report.-
 1
1 -
2
-
3
-
4
-
5
-
6
-
7
-
8
-
9
-
10
-
11
-
12
-
13
-
14
-
15
-
16
-
17
-
18
-
19
-
20
-
21
-
22
-
23
-
24
-
25
-
26
-
27
-
28
-
29
-
30
-
31
-
32
-
33
-
34
-
35
-
36
-
37
-
38
-
39
-
40
-
41
-
42
-
43
-
44
-
45
-
46
-
47
-
48
-
49
-
50
-
51
-
52
-
53
-
54
-
55
-
56
-
57
-
58
-
59
-
60
-
61
-
62
-
63
-
64
-
65
-
66
-
67
-
68
-
69
-
70
-
71
-
72
-
73
-
74
-
75
-
76
-
77
-
78
-
79
-
80
-
81
-
82
-
83
-
84
-
85
-
86
-
87
-
88
-
89
-
 90
90 -
 91
91 -
 92
92 -
 93
93 -
 94
94 -
 95
95 -
 96
96 -
 97
97 -
 98
98 -
 99
99 -
 100
100 -
 101
101 -
 102
102 -
 103
103 -
 104
104 -
 105
105 -
 106
106 -
 107
107 -
 108
108 -
 109
109 -
 110
110 -
111
-
112
 |
 |

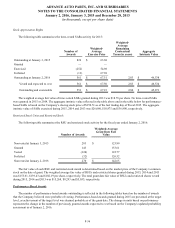
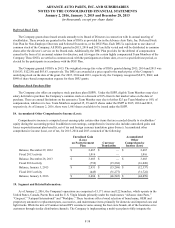
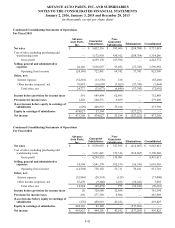
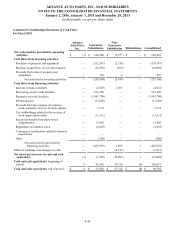
ADVANCE AUTO PARTS, INC. AND SUBSIDIARIES
NOTES TO THE CONSOLIDATED FINANCIAL STATEMENTS
January 2, 2016, January 3, 2015 and December 28, 2013
(in thousands, except per share data)
F-46
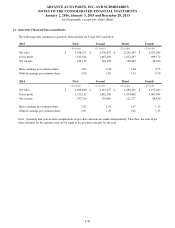
21. Quarterly Financial Data (unaudited):
The following table summarizes quarterly financial data for Fiscal 2015 and 2014:
2015 First Second Third Fourth
(16 weeks) (12 weeks) (12 weeks) (12 weeks)
Net sales $ 3,038,233 $ 2,370,037 $ 2,295,203 $ 2,033,545
Gross profit 1,393,924 1,087,289 1,032,387 909,172
Net income 148,112 149,998 120,469 54,819
Basic earnings per common share 2.02 2.04 1.64 0.75
Diluted earnings per common share 2.00 2.03 1.63 0.74
2014 First Second Third Fourth
(16 weeks) (12 weeks) (12 weeks) (13 weeks)
Net sales $ 2,969,499 $ 2,347,697 $ 2,289,456 $ 2,237,209
Gross profit 1,353,122 1,062,108 1,034,442 1,003,941
Net income 147,726 139,488 122,177 84,434
Basic earnings per common share 2.02 1.91 1.67 1.15
Diluted earnings per common share 2.01 1.89 1.66 1.15
Note: Quarterly and year-to-date computations of per share amounts are made independently. Therefore, the sum of per
share amounts for the quarters may not be equal to the per share amount for the year.