Advance Auto Parts 2015 Annual Report Download - page 43
Download and view the complete annual report
Please find page 43 of the 2015 Advance Auto Parts annual report below. You can navigate through the pages in the report by either clicking on the pages listed below, or by using the keyword search tool below to find specific information within the annual report.-
 1
1 -
2
-
3
-
4
-
5
-
6
-
7
-
8
-
9
-
10
-
11
-
12
-
13
-
14
-
15
-
16
-
17
-
18
-
19
-
20
-
21
-
22
-
23
-
24
-
25
-
26
-
27
-
28
-
29
-
30
-
31
-
32
-
 33
33 -
 34
34 -
 35
35 -
 36
36 -
 37
37 -
 38
38 -
 39
39 -
 40
40 -
 41
41 -
 42
42 -
 43
43 -
 44
44 -
 45
45 -
 46
46 -
 47
47 -
 48
48 -
 49
49 -
 50
50 -
 51
51 -
 52
52 -
 53
53 -
54
-
55
-
56
-
57
-
58
-
59
-
60
-
61
-
62
-
63
-
64
-
65
-
66
-
67
-
68
-
69
-
70
-
71
-
72
-
73
-
74
-
75
-
76
-
77
-
78
-
79
-
80
-
81
-
82
-
83
-
84
-
85
-
86
-
87
-
88
-
89
-
90
-
91
-
92
-
93
-
94
-
95
-
96
-
97
-
98
-
99
-
100
-
101
-
102
-
103
-
104
-
105
-
106
-
107
-
108
-
109
-
110
-
111
-
112
 |
 |

30
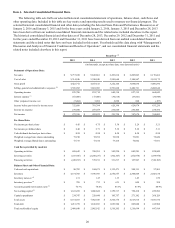
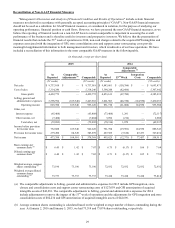
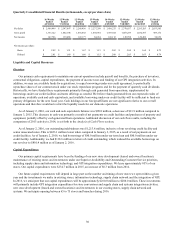
Quarterly Consolidated Financial Results (in thousands, except per share data)
16-Weeks
Ended
4/19/2014
12-Weeks
Ended
7/12/2014
12-Weeks
Ended
10/4/2014
13-Weeks
Ended
1/3/2015
16-Weeks
Ended
4/25/2015
12-Weeks
Ended
7/18/2015
12-Weeks
Ended
10/10/2015
12-Weeks
Ended
1/2/2016
Net Sales $ 2,969,499 $ 2,347,697 $ 2,289,456 $ 2,237,209 $ 3,038,233 $ 2,370,037 $ 2,295,203 $ 2,033,545
Gross profit 1,353,122 1,062,108 1,034,442 1,003,941 1,393,924 1,087,289 1,032,387 909,172
Net income 147,726 139,488 122,177 84,434 148,112 149,998 120,469 54,819
Net income per share:
Basic $ 2.02 $ 1.91 $ 1.67 $ 1.15 $ 2.02 $ 2.04 $ 1.64 $ 0.75
Diluted $ 2.01 $ 1.89 $ 1.66 $ 1.15 $ 2.00 $ 2.03 $ 1.63 $ 0.74
Liquidity and Capital Resources
Overview
Our primary cash requirements to maintain our current operations include payroll and benefits, the purchase of inventory,
contractual obligations, capital expenditures, the payment of income taxes and funding of our GPI integration activities. In
addition, we may use available funds for acquisitions, to repay borrowings under our credit agreement, to periodically
repurchase shares of our common stock under our stock repurchase programs and for the payment of quarterly cash dividends.
Historically, we have funded these requirements primarily through cash generated from operations, supplemented by
borrowings under our credit facilities and notes offerings as needed. We believe funds generated from our expected results of
operations, available cash and cash equivalents, and available borrowing under our credit facility will be sufficient to fund our
primary obligations for the next fiscal year. Cash holdings in our foreign affiliates are not significant relative to our overall
operations and therefore would not restrict the liquidity needs for our domestic operations.
As of January 2, 2016, our cash and cash equivalents balance was $90.8 million, a decrease of $13.9 million compared to
January 3, 2015. This decrease in cash was primarily a result of net payments on credit facilities and purchases of property and
equipment, partially offset by cash generated from operations. Additional discussion of our cash flow results, including the
comparison of 2015 activity to 2014, is set forth in the Analysis of Cash Flows section.
As of January 2, 2016, our outstanding indebtedness was $1,213.8 million, inclusive of our revolving credit facility and
senior unsecured notes. This is $423.1 million lower when compared to January 3, 2015, as a result of net payments on our
credit facilities. As of January 2, 2016, we had borrowings of $80.0 million under our term loan and $80.0 million under our
credit facility. Additionally, we had $118.6 million in letters of credit outstanding, which reduced the available borrowings on
our revolver to $801.4 million as of January 2, 2016.
Capital Expenditures
Our primary capital requirements have been the funding of our new store development (leased and owned locations),
maintenance of existing stores and investments under our Superior Availability and Outstanding Customer Service priorities,
including supply chain and information technology, and GPI integration expenditures. We lease approximately 85% of our
stores. Our capital expenditures were $234.7 million in 2015, an increase of $6.3 million from 2014.
Our future capital requirements will depend in large part on the number and timing of new stores we open within a given
year and the investments we make in existing stores, information technology, supply chain network and the integration of GPI.
In 2016, we anticipate that our capital expenditures will be approximately $260.0 million to $280.0 million. These investments
will primarily include GPI integration expenditures for store conversions and supply chain and systems integration activities;
new store development (leased and owned locations); and investments in our existing stores, supply chain network and
systems. We anticipate opening between 65 to 75 stores and branches during 2016.