Advance Auto Parts 2015 Annual Report Download - page 59
Download and view the complete annual report
Please find page 59 of the 2015 Advance Auto Parts annual report below. You can navigate through the pages in the report by either clicking on the pages listed below, or by using the keyword search tool below to find specific information within the annual report.-
 1
1 -
2
-
3
-
4
-
5
-
6
-
7
-
8
-
9
-
10
-
11
-
12
-
13
-
14
-
15
-
16
-
17
-
18
-
19
-
20
-
21
-
22
-
23
-
24
-
25
-
26
-
27
-
28
-
29
-
30
-
31
-
32
-
33
-
34
-
35
-
36
-
37
-
38
-
39
-
40
-
41
-
42
-
43
-
44
-
45
-
46
-
47
-
48
-
 49
49 -
 50
50 -
 51
51 -
 52
52 -
 53
53 -
 54
54 -
 55
55 -
 56
56 -
 57
57 -
 58
58 -
 59
59 -
 60
60 -
 61
61 -
 62
62 -
 63
63 -
 64
64 -
 65
65 -
 66
66 -
 67
67 -
 68
68 -
 69
69 -
70
-
71
-
72
-
73
-
74
-
75
-
76
-
77
-
78
-
79
-
80
-
81
-
82
-
83
-
84
-
85
-
86
-
87
-
88
-
89
-
90
-
91
-
92
-
93
-
94
-
95
-
96
-
97
-
98
-
99
-
100
-
101
-
102
-
103
-
104
-
105
-
106
-
107
-
108
-
109
-
110
-
111
-
112
 |
 |

F-5
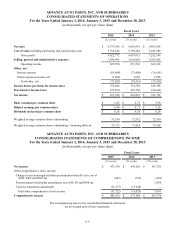
ADVANCE AUTO PARTS, INC. AND SUBSIDIARIES
CONSOLIDATED STATEMENTS OF OPERATIONS
For the Years Ended January 2, 2016, January 3, 2015 and December 28, 2013
(in thousands, except per share data)
Fiscal Years
2015 2014 2013
(52 weeks) (53 weeks) (52 weeks)
Net sales $ 9,737,018 $ 9,843,861 $ 6,493,814
Cost of sales, including purchasing and warehousing costs 5,314,246 5,390,248 3,241,668
Gross profit 4,422,772 4,453,613 3,252,146
Selling, general and administrative expenses 3,596,992 3,601,903 2,591,828
Operating income 825,780 851,710 660,318
Other, net:
Interest expense (65,408)(73,408)(36,618)
Other (expense) income, net (7,484) 3,092 2,698
Total other, net (72,892)(70,316)(33,920)
Income before provision for income taxes 752,888 781,394 626,398
Provision for income taxes 279,490 287,569 234,640
Net income $ 473,398 $ 493,825 $ 391,758
Basic earnings per common share $ 6.45 $ 6.75 $ 5.36
Diluted earnings per common share $ 6.40 $ 6.71 $ 5.32
Dividends declared per common share $ 0.24 $ 0.24 $ 0.24
Weighted average common shares outstanding 73,190 72,932 72,930
Weighted average common shares outstanding - assuming dilution 73,733 73,414 73,414
ADVANCE AUTO PARTS, INC. AND SUBSIDIARIES
CONSOLIDATED STATEMENTS OF COMPREHENSIVE INCOME
For the Years Ended January 2, 2016, January 3, 2015 and December 28, 2013
(in thousands, except per share data)
Fiscal Years
2015 2014 2013
(52 weeks) (53 weeks) (52 weeks)
Net income $ 473,398 $ 493,825 $ 391,758
Other comprehensive (loss) income:
Changes in net unrecognized other postretirement benefit costs, net of
$289, $483 and $503 tax (445)(752)(438)
Postretirement benefit plan amendment, net of $0, $0 and $904 tax — — 1,454
Currency translation adjustments (31,277)(15,268)—
Total other comprehensive (loss) income (31,722)(16,020) 1,016
Comprehensive income $ 441,676 $ 477,805 $ 392,774
The accompanying notes to the consolidated financial statements
are an integral part of these statements.