Advance Auto Parts 2015 Annual Report Download - page 34
Download and view the complete annual report
Please find page 34 of the 2015 Advance Auto Parts annual report below. You can navigate through the pages in the report by either clicking on the pages listed below, or by using the keyword search tool below to find specific information within the annual report.-
 1
1 -
2
-
3
-
4
-
5
-
6
-
7
-
8
-
9
-
10
-
11
-
12
-
13
-
14
-
15
-
16
-
17
-
18
-
19
-
20
-
21
-
22
-
23
-
 24
24 -
 25
25 -
 26
26 -
 27
27 -
 28
28 -
 29
29 -
 30
30 -
 31
31 -
 32
32 -
 33
33 -
 34
34 -
 35
35 -
 36
36 -
 37
37 -
 38
38 -
 39
39 -
 40
40 -
 41
41 -
 42
42 -
 43
43 -
 44
44 -
45
-
46
-
47
-
48
-
49
-
50
-
51
-
52
-
53
-
54
-
55
-
56
-
57
-
58
-
59
-
60
-
61
-
62
-
63
-
64
-
65
-
66
-
67
-
68
-
69
-
70
-
71
-
72
-
73
-
74
-
75
-
76
-
77
-
78
-
79
-
80
-
81
-
82
-
83
-
84
-
85
-
86
-
87
-
88
-
89
-
90
-
91
-
92
-
93
-
94
-
95
-
96
-
97
-
98
-
99
-
100
-
101
-
102
-
103
-
104
-
105
-
106
-
107
-
108
-
109
-
110
-
111
-
112
 |
 |

21
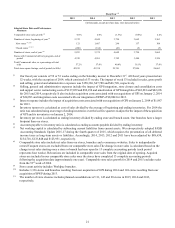
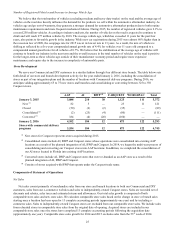
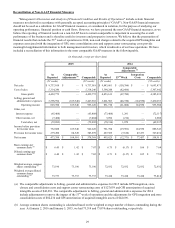
Fiscal Year (1)
2015 2014 2013 2012 2011
(in thousands, except per share data, store data and ratios)
Selected Store Data and Performance
Measures:
Comparable store sales growth (8) 0.0% 2.0% (1.5%) (0.8%) 2.2%
Number of stores, beginning of year (9) 5,372 4,049 3,794 3,662 3,563
New stores (9) (10) 121 1,487 296 137 104
Closed stores (9) (11) (200) (164) (41) (5) (5)
Number of stores, end of year (9) 5,293 5,372 4,049 3,794 3,662
Stores with Commercial delivery program, end of
period 4,745 4,981 3,702 3,484 3,326
Total Commercial sales, as a percentage of total
sales 57.2% 57.0% 40.4% 38.1% 37.0%
Total store square footage, end of period (in 000s) 42,185 43,338 29,701 27,806 26,663
(1) Our fiscal year consists of 52 or 53 weeks ending on the Saturday nearest to December 31st. All fiscal years presented are
52 weeks, with the exception of 2014, which consisted of 53 weeks. The impact of week 53 included in sales, gross profit
and selling, general and administrative expenses was $150,386, $67,780 and $46,720, respectively.
(2) Selling, general and administrative expenses include the impact of GPI integration, store closure and consolidation costs
and support center restructuring costs of $127,059 and $82,234 and amortization of GPI intangibles of $42,281 and $42,696
for 2015 and 2014, respectively. It also includes acquisition costs associated with our acquisition of GPI on January 2, 2014
of $24,983 and integration costs associated with our integration of BWP of $8,004 for 2013.
(3) Interest expense includes the impact of acquisition costs associated with our acquisition of GPI on January 2, 2014 of $1,987
for 2013.
(4) Inventory turnover is calculated as cost of sales divided by the average of beginning and ending inventories. For 2014 the
ratio was calculated using an average of ending inventories over the last five quarters to adjust for the impact of the acquisition
of GPI and its inventories on January 2, 2014.
(5) Inventory per store is calculated as ending inventory divided by ending store and branch count. Our branches have a larger
footprint than our stores.
(6) Accounts payable to inventory ratio is calculated as ending accounts payable divided by ending inventory.
(7) Net working capital is calculated by subtracting current liabilities from current assets. We retrospectively adopted FASB
Accounting Standards Update 2015-17 during the fourth quarter of 2015, which requires the presentation of all deferred
income taxes as long-term assets or liabilities. Accordingly, 2014, 2013, 2012 and 2011 have been adjusted by $88,650,
$134,718, $133,848 and $123,951, respectively.
(8) Comparable store sales include net sales from our stores, branches and e-commerce websites. Sales to independently-
owned Carquest stores are excluded from our comparable store sales.The change in store sales is calculated based on the
change in net sales starting once a store or branch has been open for 13 complete accounting periods (each period
represents four weeks). Relocations are included in comparable store sales from the original date of opening. Acquired
stores are included in our comparable store sales once the stores have completed 13 complete accounting periods
following the acquisition date (approximately one year). Comparable store sales growth for 2014 and 2015 excludes sales
from the 53rd week of 2014.
(9) Store count activity includes Worldpac branches.
(10) Includes 1,336 stores and branches resulting from our acquisition of GPI during 2014 and 124 stores resulting from our
acquisition of BWP during 2013.
(11) The number of store closures includes planned consolidations of 111, 145 and 20 stores in 2015, 2014 and 2013,
respectively.
(1)