Advance Auto Parts 2015 Annual Report Download - page 38
Download and view the complete annual report
Please find page 38 of the 2015 Advance Auto Parts annual report below. You can navigate through the pages in the report by either clicking on the pages listed below, or by using the keyword search tool below to find specific information within the annual report.-
 1
1 -
2
-
3
-
4
-
5
-
6
-
7
-
8
-
9
-
10
-
11
-
12
-
13
-
14
-
15
-
16
-
17
-
18
-
19
-
20
-
21
-
22
-
23
-
24
-
25
-
26
-
27
-
 28
28 -
 29
29 -
 30
30 -
 31
31 -
 32
32 -
 33
33 -
 34
34 -
 35
35 -
 36
36 -
 37
37 -
 38
38 -
 39
39 -
 40
40 -
 41
41 -
 42
42 -
 43
43 -
 44
44 -
 45
45 -
 46
46 -
 47
47 -
 48
48 -
49
-
50
-
51
-
52
-
53
-
54
-
55
-
56
-
57
-
58
-
59
-
60
-
61
-
62
-
63
-
64
-
65
-
66
-
67
-
68
-
69
-
70
-
71
-
72
-
73
-
74
-
75
-
76
-
77
-
78
-
79
-
80
-
81
-
82
-
83
-
84
-
85
-
86
-
87
-
88
-
89
-
90
-
91
-
92
-
93
-
94
-
95
-
96
-
97
-
98
-
99
-
100
-
101
-
102
-
103
-
104
-
105
-
106
-
107
-
108
-
109
-
110
-
111
-
112
 |
 |

25
Number of Registered Vehicles and Increase in Average Vehicle Age
We believe that the total number of vehicles (excluding medium and heavy duty trucks) on the road and the average age of
vehicles on the road also heavily influence the demand for the products we sell within the automotive aftermarket industry. As
vehicles age and go out-of-warranty, they generate a stronger demand for automotive aftermarket products due to both routine
maintenance requirements and more frequent mechanical failures. During 2015, the number of registered vehicles grew 2.1% to
a record 258 million vehicles. According to industry analysts, the number of vehicles on the road is expected to continue to
climb and will reach 277 million vehicles by 2018. The average vehicle age, which has exceeded 11 years for the past four
years, also points to favorable growth in the industry. While new car registrations during 2015 were almost 60% higher than in
the recession low of 2009, the scrappage rate for 2015 was at its lowest rate in 13 years. As a result, the mix of vehicles is
shifting as reflected by a five-year compounded annual growth rate of 4.4% for vehicles over 11 years old compared to a
compounded annual growth rate for all vehicles of 0.7%. We believe that the stabilization of the average age of vehicles will
continue to benefit our industry in the near term and the overall increase in the total number of vehicles on the road is positive
for the longer-term as these vehicles age outside of their manufacturer warranty period and require more expensive
maintenance and repairs due to the increase in complexity of automobile parts.
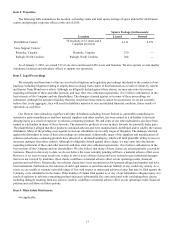
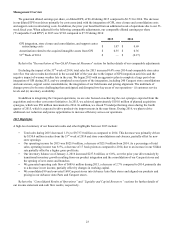
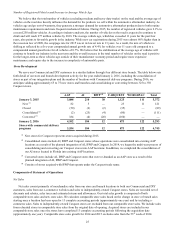
Store Development
We serve our Commercial and DIY customers in a similar fashion through four different store brands. The table below sets
forth detail of our store and branch development activity for the year ended January 2, 2016, including the consolidation of
stores as part of our integration plans and the number of locations with Commercial delivery programs. During 2016, we
anticipate adding approximately 65 to 75 new stores and branches and consolidating or converting between 325 to 350
Carquest stores.
AAP AI BWP (4) CARQUEST WORLDPAC Total
January 3, 2015 3,888 210 38 1,125 111 5,372
New (1) 82 5 — 23 11 121
Closed (50) (2) (2)(35)—
(89)
Consolidated (2) (2) (25) (4)(80)—
(111)
Converted (3) 184 (4) (20)(160)——
January 2, 2016 4,102 184 12 873 122 5,293
Stores with commercial delivery
programs 3,554 184 12 873 122 4,745
(1) New stores for Carquest represents stores acquired during 2015.
(2) Consolidated stores include AI, BWP and Carquest stores whose operations were consolidated into existing AAP
locations as a result of the planned integration of AI, BWP and Carquest. In 2014, we began the multi-year process of
consolidating and converting our Carquest stores into AAP locations. In addition, we completed the consolidation of
our AI stores located in Florida into existing AAP locations.
(3) Converted stores include AI, BWP and Carquest stores that were re-branded as an AAP store as a result of the
planned integration of AI, BWP and Carquest.
(4) Consists of stores acquired with BWP that operate under the Carquest trade name.
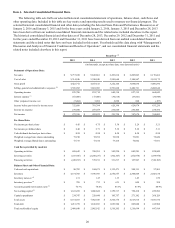
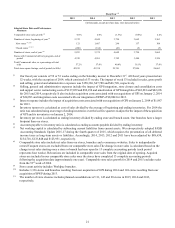
Components of Statement of Operations
Net Sales
Net sales consist primarily of merchandise sales from our store and branch locations to both our Commercial and DIY
customers, sales from our e-commerce websites and sales to independently-owned Carquest stores. Sales are recorded net of
discounts and rebates, sales taxes and estimated returns and allowances. Our total sales growth is comprised of both
comparable store sales and new store sales. We calculate comparable store sales based on the change in store or branch sales
starting once a location has been open for 13 complete accounting periods (approximately one year) and by including e-
commerce sales. Sales to independently-owned Carquest stores are excluded from our comparable store sales. We include sales
from relocated stores in comparable store sales from the original date of opening. Acquired stores are included in our
comparable store sales once the stores have completed 13 complete accounting periods following the acquisition date
(approximately one year). Comparable store sales growth for 2014 and 2015 excludes sales from the 53rd week of 2014.