Advance Auto Parts 2015 Annual Report Download - page 77
Download and view the complete annual report
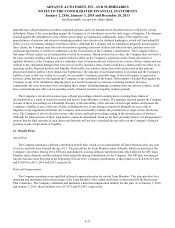
Please find page 77 of the 2015 Advance Auto Parts annual report below. You can navigate through the pages in the report by either clicking on the pages listed below, or by using the keyword search tool below to find specific information within the annual report.
ADVANCE AUTO PARTS, INC. AND SUBSIDIARIES
NOTES TO THE CONSOLIDATED FINANCIAL STATEMENTS
January 2, 2016, January 3, 2015 and December 28, 2013
(in thousands, except per share data)
F-23
Intangible Assets Other Than Goodwill
In 2014, the Company recorded an increase to intangible assets of $757,453 related to the acquisition of GPI and nine
stores. The increase included customer relationships of $330,293 which are being amortized over 12 years, non-competes
totaling $50,695 which are being amortized over 5 years and favorable leases of $56,465 which are being amortized over the
life of the leases at a weighted average of 4.5 years. The increase also includes indefinite-lived intangibles of $320,000 from
acquired brands.
Amortization expense was $53,056, $56,499 and $7,974 for 2015, 2014 and 2013, respectively. The gross carrying
amounts and accumulated amortization of acquired intangible assets as of January 2, 2016 and January 3, 2015 are comprised
of the following:
January 2, 2016 January 3, 2015
Gross
Carrying
Amount
Accumulated
Amortization Net
Gross
Carrying
Amount
Accumulated
Amortization Net
Amortized intangible assets:
Customer relationships $ 358,655 $ (70,367) $ 288,288 $ 362,483 $ (40,609) $ 321,874
Acquired technology 8,850 (8,850) — 8,850 (8,569) 281
Favorable leases 56,040 (23,984) 32,056 56,342 (11,939) 44,403
Non-compete and other 57,430 (25,368) 32,062 56,780 (14,596) 42,184
480,975 (128,569) 352,406 484,455 (75,713) 408,742
Unamortized intangible assets:
Brands, trademark and
tradenames 334,719 — 334,719 339,383 — 339,383
Total intangible assets $ 815,694 $ (128,569) $ 687,125 $ 823,838 $ (75,713) $ 748,125
Future Amortization Expense
The table below shows expected amortization expense for the next five years for acquired intangible assets recorded as of
January 2, 2016:
Fiscal Year Amount
2016 $ 47,980
2017 45,626
2018 42,615
2019 31,855
2020 31,539
Thereafter 152,791


