Advance Auto Parts 2015 Annual Report Download - page 39
Download and view the complete annual report
Please find page 39 of the 2015 Advance Auto Parts annual report below. You can navigate through the pages in the report by either clicking on the pages listed below, or by using the keyword search tool below to find specific information within the annual report.-
 1
1 -
2
-
3
-
4
-
5
-
6
-
7
-
8
-
9
-
10
-
11
-
12
-
13
-
14
-
15
-
16
-
17
-
18
-
19
-
20
-
21
-
22
-
23
-
24
-
25
-
26
-
27
-
28
-
 29
29 -
 30
30 -
 31
31 -
 32
32 -
 33
33 -
 34
34 -
 35
35 -
 36
36 -
 37
37 -
 38
38 -
 39
39 -
 40
40 -
 41
41 -
 42
42 -
 43
43 -
 44
44 -
 45
45 -
 46
46 -
 47
47 -
 48
48 -
 49
49 -
50
-
51
-
52
-
53
-
54
-
55
-
56
-
57
-
58
-
59
-
60
-
61
-
62
-
63
-
64
-
65
-
66
-
67
-
68
-
69
-
70
-
71
-
72
-
73
-
74
-
75
-
76
-
77
-
78
-
79
-
80
-
81
-
82
-
83
-
84
-
85
-
86
-
87
-
88
-
89
-
90
-
91
-
92
-
93
-
94
-
95
-
96
-
97
-
98
-
99
-
100
-
101
-
102
-
103
-
104
-
105
-
106
-
107
-
108
-
109
-
110
-
111
-
112
 |
 |

26
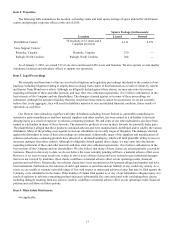
Cost of Sales
Our cost of sales consists of merchandise costs, net of incentives under vendor programs; inventory shrinkage, defective
merchandise and warranty costs; and warehouse and distribution expenses, including depreciation and amortization. Gross
profit as a percentage of net sales may be affected by (i) variations in our product mix, (ii) price changes in response to
competitive factors and fluctuations in merchandise costs, (iii) vendor programs, (iv) inventory shrinkage, (v) defective
merchandise and warranty costs and (vi) warehouse and distribution costs. We seek to minimize fluctuations in merchandise
costs and instability of supply by entering into long-term purchasing agreements, without minimum purchase volume
requirements, when we believe it is advantageous. Our cost of sales and gross profit rates may not be comparable to that of our
competitors due to differences in industry practice regarding the classification of certain costs and mix of Commercial and DIY
sales. See Note 1, Summary of Significant Accounting Policies, to our Consolidated Financial Statements elsewhere in this
report for additional discussion of these costs.
Selling, General and Administrative Expenses
SG&A expenses consist of store payroll, store occupancy (including rent and depreciation), advertising expenses,
acquisition and integration related expenses, Commercial delivery expenses, other store expenses and general and
administrative expenses, including salaries and related benefits of store support center Team Members, share-based
compensation expenses, store support center administrative office expenses, data processing, professional expenses, self-
insurance costs, depreciation and amortization, closed facility expense and impairment charges, if any, and other related
expenses. See Note 1, Summary of Significant Accounting Policies, to our Consolidated Financial Statements for additional
discussion of these costs.
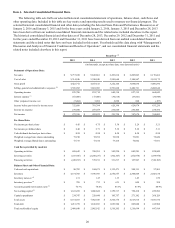
Consolidated Results of Operations
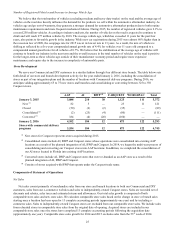
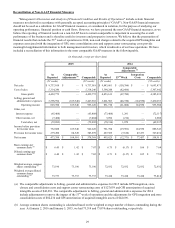
The following table sets forth certain of our operating data expressed as a percentage of net sales for the periods indicated.
Fiscal Year Ended
January 2,
2016
January 3,
2015
December 28,
2013
Net sales 100.0% 100.0% 100.0%
Cost of sales, including purchasing and
warehousing costs 54.6 54.8 49.9
Gross profit 45.4 45.2 50.1
Selling, general and administrative expenses 36.9 36.6 39.9
Operating income 8.5 8.7 10.2
Interest expense (0.7)(0.7)(0.6)
Other, net (0.1) 0.0 0.0
Provision for income taxes 2.9 2.9 3.6
Net income 4.9% 5.0% 6.0%
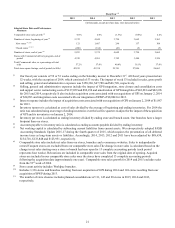
2015 Compared to 2014
Net Sales
Net sales for 2015 were $9,737.0 million, a decline of $106.8 million, or 1.1%, from net sales in 2014. This decrease was
primarily due to the 53rd week of 2014 which contributed $150.4 million in sales to 2014. Excluding the impact of the 53rd
week, net sales for 2015 increased 0.4% over 2014, while comparable store sales were flat. The slight increase in net sales
when excluding the 53rd week is due to the addition of 121 new stores, partially offset by the portion of sales that did not
transfer from the consolidation of 111 stores and closure of 89 stores during 2015.
Our comparable store sales for the year were negatively impacted by disruptions from integration activities, including the
alignment of our field structure, products and pricing. In addition the impact of foreign currency exchange rates on our
Canadian operations reduced comparable store sales for the year by 36 basis points. Partially offsetting these negative impacts
is an estimated 50 bps of positive contribution from the sales transferred to comparable stores from stores consolidated during
2015. Our fourth quarter of 2015 was our weakest quarter in terms of comparable store sales with a decline of 2.5%. The