Advance Auto Parts 2015 Annual Report Download - page 51
Download and view the complete annual report
Please find page 51 of the 2015 Advance Auto Parts annual report below. You can navigate through the pages in the report by either clicking on the pages listed below, or by using the keyword search tool below to find specific information within the annual report.-
 1
1 -
2
-
3
-
4
-
5
-
6
-
7
-
8
-
9
-
10
-
11
-
12
-
13
-
14
-
15
-
16
-
17
-
18
-
19
-
20
-
21
-
22
-
23
-
24
-
25
-
26
-
27
-
28
-
29
-
30
-
31
-
32
-
33
-
34
-
35
-
36
-
37
-
38
-
39
-
40
-
 41
41 -
 42
42 -
 43
43 -
 44
44 -
 45
45 -
 46
46 -
 47
47 -
 48
48 -
 49
49 -
 50
50 -
 51
51 -
 52
52 -
 53
53 -
 54
54 -
 55
55 -
 56
56 -
 57
57 -
 58
58 -
 59
59 -
 60
60 -
 61
61 -
62
-
63
-
64
-
65
-
66
-
67
-
68
-
69
-
70
-
71
-
72
-
73
-
74
-
75
-
76
-
77
-
78
-
79
-
80
-
81
-
82
-
83
-
84
-
85
-
86
-
87
-
88
-
89
-
90
-
91
-
92
-
93
-
94
-
95
-
96
-
97
-
98
-
99
-
100
-
101
-
102
-
103
-
104
-
105
-
106
-
107
-
108
-
109
-
110
-
111
-
112
 |
 |

38
Warranty Reserves
We offer limited warranties on certain products that range from 30 days to lifetime warranties; the warranty obligation on
the majority of merchandise sold by us with a manufacturer’s warranty is borne by our vendors. However, we have an
obligation to provide customers free replacement of merchandise or merchandise at a prorated cost if under a warranty and not
covered by the manufacturer. Merchandise sold with warranty coverage by us primarily includes batteries but may also include
other parts such as brakes and shocks. We estimate and record a reserve for future warranty claims at the time of sale based on
the historical return experience of the respective product sold. If claims experience differs from historical levels, revisions in
our estimates may be required, which could have an impact on our consolidated statement of operations. To the extent vendors
provide upfront allowances in lieu of accepting the obligation for warranty claims and the allowance is in excess of the related
warranty expense, the excess is recorded as a reduction to cost of sales.
A 10% change in the warranty reserves at January 2, 2016 would have affected net income by approximately $2.8 million
for the fiscal year ended January 2, 2016.
New Accounting Pronouncements
For a description of recently adopted and issued accounting standards, including the expected dates of adoption and
estimated effects, if any, on our consolidated financial statements, see Recently Adopted Accounting Pronouncements and
Recently Issued Accounting Pronouncements in Note 1 to the Consolidated Financial Statements in this Report on Form 10-K.
Item 7A. Quantitative and Qualitative Disclosures about Market Risks.
Interest Rate Risk
Our primary financial market risk is due to changes in interest rates. Historically, we have reduced our exposure to changes
in interest rates by entering into various interest rate hedge instruments such as interest rate swap contracts and treasury lock
agreements. We have historically utilized interest rate swaps to convert variable rate debt to fixed rate debt and to lock in fixed
rates on future debt issuances. Our interest rate hedge instruments have been designated as cash flow hedges. We had no
derivative instruments outstanding as of January 2, 2016.
The interest rates on borrowings under our revolving credit facility and term loan are based, at our option, on adjusted
LIBOR, plus a margin, or an alternate base rate, plus a margin. As of January 2, 2016 we had $80.0 million of borrowings
outstanding under our revolving credit facility and $80.0 million outstanding under our term loan and are therefore exposed to
interest rate risk due to changes in LIBOR or alternate base rate. There is no interest rate risk associated with our 2020, 2022 or
2023 Notes, as the interest rates are fixed at 5.75%, 4.50% and 4.50%, respectively, per annum.
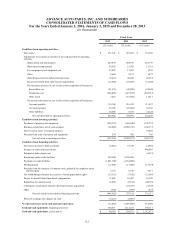
The table below presents principal cash flows and related weighted average interest rates on our revolving credit facility
and term loan outstanding at January 2, 2016, by expected maturity dates. Weighted average variable rates are based on implied
forward rates in the yield curve at January 2, 2016. Implied forward rates should not be considered a predictor of actual future
interest rates.
2016 2017 2018 2019 2020 Thereafter Total
Fair
Market
Liability
(dollars in thousands)
Variable rate $ — $ — $ 80,000 $ 80,000 $ — $ — $ 160,000 $ 160,000
Weighted average
interest rate 1.9% 2.2% 2.6% 2.9% — — 2.2% —
Credit Risk
Our financial assets that are exposed to credit risk consist primarily of trade accounts receivable and vendor receivables.
We are exposed to normal credit risk from customers. Our concentration of credit risk is limited because our customer base
consists of a large number of customers with relatively small balances, which allows the credit risk to be spread across a broad
base. We strive to maintain a close working relationship with our vendors and frequently monitor their financial strength. We
have not historically had significant credit losses.