Advance Auto Parts 2015 Annual Report Download - page 2
Download and view the complete annual report
Please find page 2 of the 2015 Advance Auto Parts annual report below. You can navigate through the pages in the report by either clicking on the pages listed below, or by using the keyword search tool below to find specific information within the annual report.-
 1
1 -
 2
2 -
 3
3 -
 4
4 -
 5
5 -
 6
6 -
 7
7 -
 8
8 -
 9
9 -
 10
10 -
 11
11 -
 12
12 -
 13
13 -
14
-
15
-
16
-
17
-
18
-
19
-
20
-
21
-
22
-
23
-
24
-
25
-
26
-
27
-
28
-
29
-
30
-
31
-
32
-
33
-
34
-
35
-
36
-
37
-
38
-
39
-
40
-
41
-
42
-
43
-
44
-
45
-
46
-
47
-
48
-
49
-
50
-
51
-
52
-
53
-
54
-
55
-
56
-
57
-
58
-
59
-
60
-
61
-
62
-
63
-
64
-
65
-
66
-
67
-
68
-
69
-
70
-
71
-
72
-
73
-
74
-
75
-
76
-
77
-
78
-
79
-
80
-
81
-
82
-
83
-
84
-
85
-
86
-
87
-
88
-
89
-
90
-
91
-
92
-
93
-
94
-
95
-
96
-
97
-
98
-
99
-
100
-
101
-
102
-
103
-
104
-
105
-
106
-
107
-
108
-
109
-
110
-
111
-
112
 |
 |
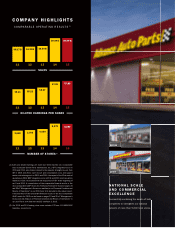
COMPANY HIGHLIGHTS
(1) Sales and diluted earnings per share have been reported on a comparable
basis to exclude General Parts International, Inc. (“GPI”) integration costs in
2015 and 2014, amortization related to the acquired intangible assets from
GPI in 2015 and 2014, store closure and consolidation costs and support
center restructuring costs in 2015 and 2014; the impact of the 53rd week of
operations in 2014; BWP integration costs in 2014 and 2013; and transaction
expenses in 2013 associated with the acquisition of GPI at the beginning of
our Fiscal 2014. A reconciliation of the comparable nancial results to the
most comparable GAAP results for 2015 and 2014 can be found on pages 23
and 29 of “Management’s Discussion and Analysis of Financial Condition and
Results of Operations” in our 2015 Form 10-K included in this annual report.
A reconciliation of the comparable nancial results to the most comparable
GAAP results for 2013 can be found on pages 22 and 29 of “Management’s
Discussion and Analysis of Financial Condition and Results of Operations” in
our 2014 Form 10-K led with the SEC on March 3, 2015.
(2) Our 2015 and 2014 ending store count includes 122 and 111 WORLDPAC
branches, respectively.
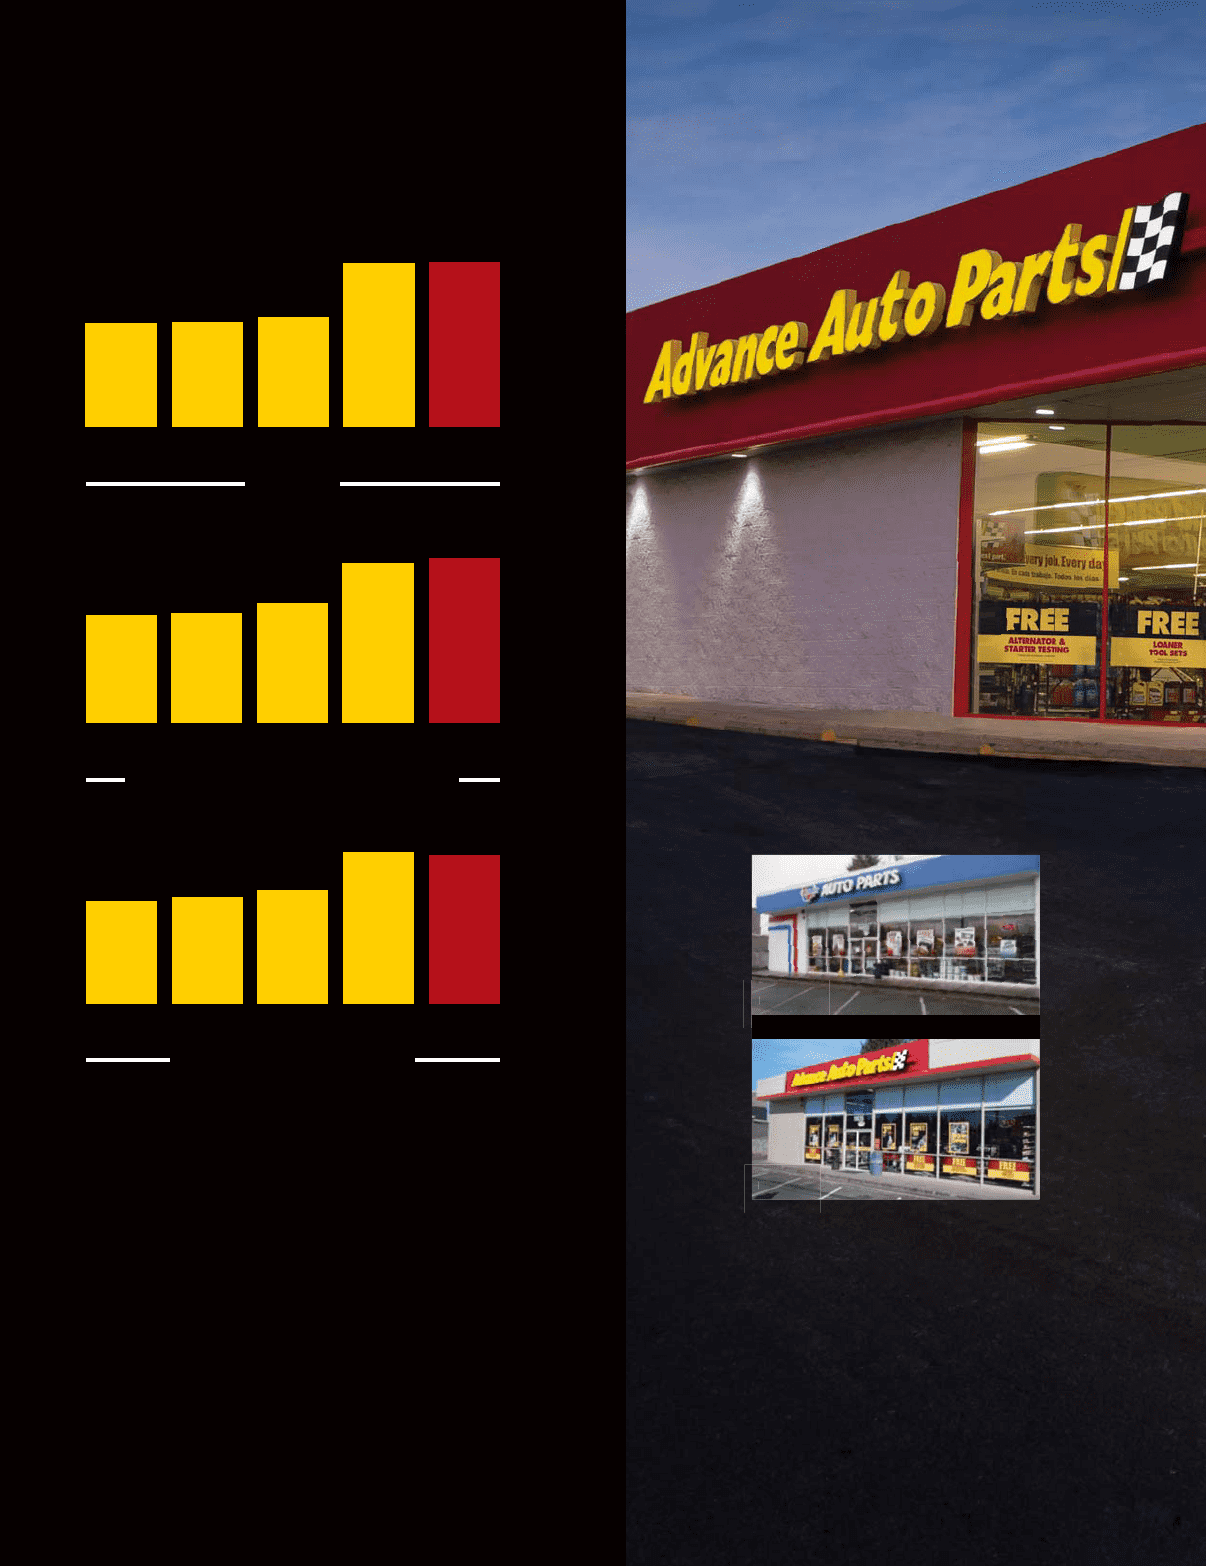
COMPARABLE OPERATING RESULTS (1)
SALES
11 12 13 14 15
DILUTED EARNINGS PER SHARE
11 12 13 14 15
NUMBER OF STORES(2)
11 12 13 14 15
$6.17 B $6.21 B $6.49 B
$9.74 B
$9.69 B
$5.11 $5.22 $5.67
$7.82
$7.59
3,662 3,794 4,049
5,293
5,372
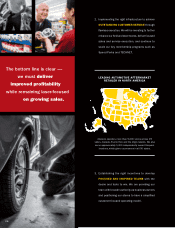
NATIONAL SCALE
AND COMMERCIAL
EXCELLENCE
Successfully combining the assets of both
companies to strengthen our national
network of more than 5,200 local stores.
BEFORE
AFTER
B
BEFO
BEFO
RE
RE
BEFORE
A
AFTE
FTE
R
R
AFTER